مؤشر

مؤشر
استراتيجية
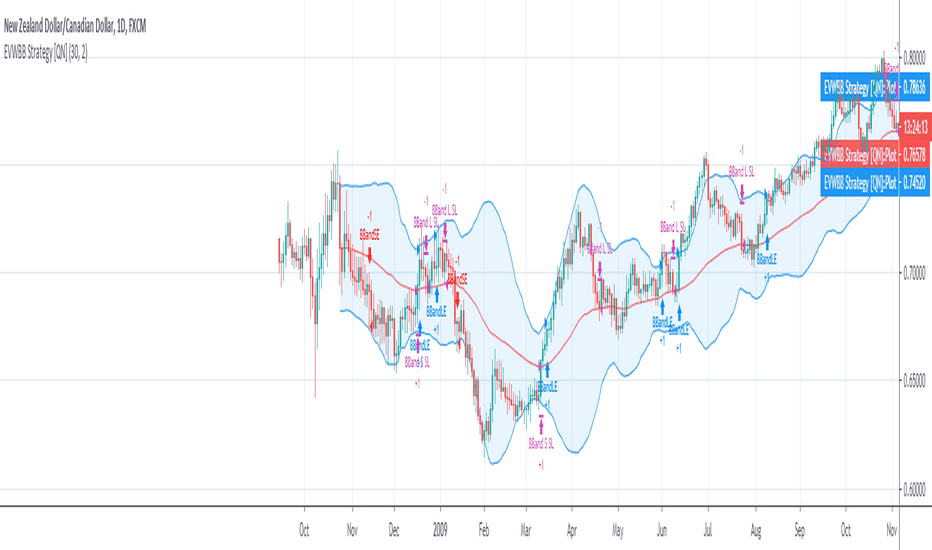
استراتيجية
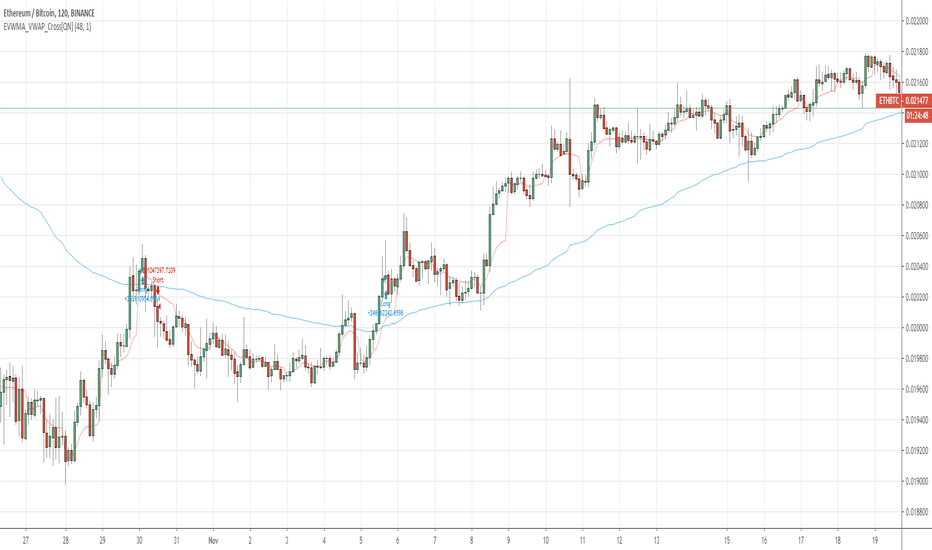
مؤشر
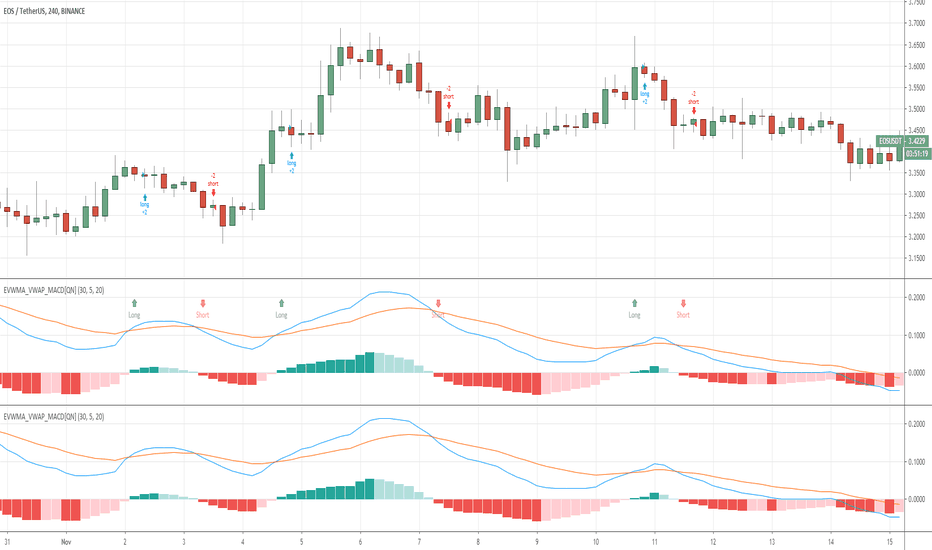
استراتيجية

MasterMAThis study demonstrates 15 different common moving averages.
SMA, Double SMA, Triple SMA
EMA, Double EMA, Triple EMA
WMA, Double WMA, Triple WMA
VWMA, Double VWMA, Triple VWMA
Hull, Double Hull, Triple Hull
Buy/Sell alerts are given for crossover/under conditions.
Triangles at the bottom, pointing up are buy signals. Triangles at the top, pointing down, are sell signals مؤشر

استراتيجية

استراتيجية

مؤشر

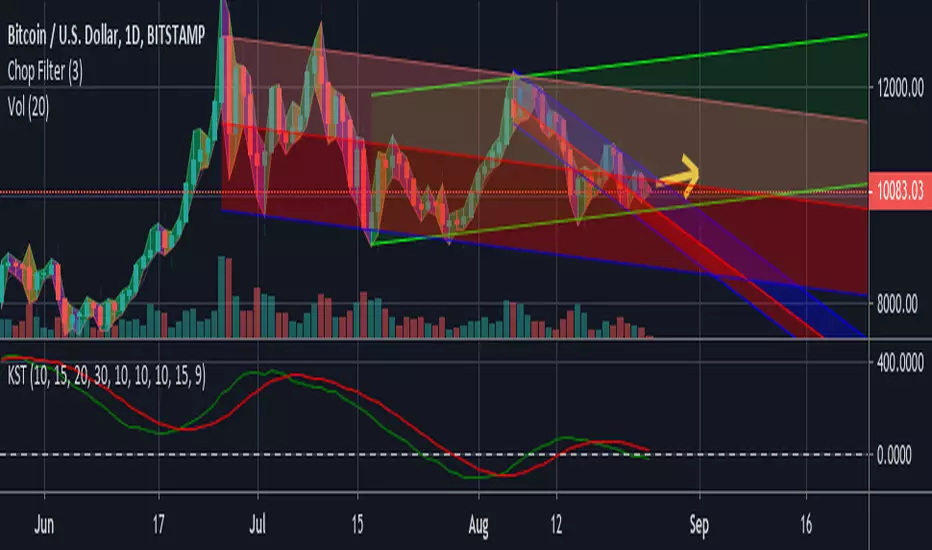
Chop FilterIt is common knowledge that most traders lose money by leaving trends too early and not letting profits run. Chop Filter attempts to paint over wrong-colored candles which might psychologically cause traders to bail off the trend. It also tries to detect potential trend reversals (experimental).
How it works. Chop Filter highlights wicks with a shaded background based on close relative to a volume-weighted moving average (vwma). If it closes up, or if there are higher lows, it shades the background blue. If it closes down, or there are lower highs, it colors the background red. Finally, it shows a big arrow indicating the direction prices are headed, based on the vwma. The arrow helps me to consider where prices might go, and play out different scenarios, rather than being a true prediction. In fact, it is often wrong when there is a lot of volatility, which can also be a good thing.
I find the shaded background has a calming effect that reduces stress. It also helps identify trends in the wicks that are otherwise difficult to see.
There are some other options to play with, such as highlighting narrowing or widening price action in yellow or optionally showing the vwma .
Have fun! مؤشر

مؤشر
مؤشر

مؤشر

مؤشر

VWMA/SMA Breakout and Divergence DetectorThis indicator compares four different values :
-Fast Simple Moving Average(SMA)
-Fast Volume Weighted Moving Average(VWMA)
-Slow SMA
-Slow VWMA
Comparing SMA's and VWMA's of the same length is a common trading tactic. Since volume is not taken into consideration when calculating Simple Moving Averages, we can gain valuable insights from the difference between the two lines.
Since volume should be increasing along with an upwards price movement, the VWMA should be greater than the SMA during a volume-supported uptrend. Thus, we can confirm an uptrend if the VWMA remains greater than the SMA. If the VWMA falls under the SMA in the midst of an upwards price movement, however, that indicates bearish divergence. The opposite is true for downtrends. If price is decreasing and volume is decreasing at the same time (as it should), then we can confirm the downtrend.
Interpreting the Graph:
If the slow SMA is greater than the slow VWMA, then the area representing the difference between the two lines is filled in red. If the slow VWMA is greater than the slow SMA, however, the area between the two is filled green.
If the fast SMA is greater than the fast VWMA, then the area between the two dotted lines is filled in red. On the other hand, the area will be filled green if the fast VWMA is greater than the slow SMA.
In addition to spotting divergences and confirming trends, the four lines can be used to spot breakouts. Typically, a VWMA crossover will precede the SMA crossover. When the fast VWMA crosses over the slow VWMA and then a SMA crossover follows shortly after, then it is a hint that a bullish trend is beginning to form.
مؤشر

مؤشر

مؤشر
مؤشر

مؤشر

مؤشر

مؤشر

مؤشر