


HANA / USDT — Long Accumulation Base & Early Expansion Hey there something is cooking :-)
January 28, 2026
HANA is coming from a very deep drawdown phase and is now showing the first meaningful signs of structural recovery after months of base building near the lows.
This is a classic post-capitulation accumulation setup, where volatility compresses
Long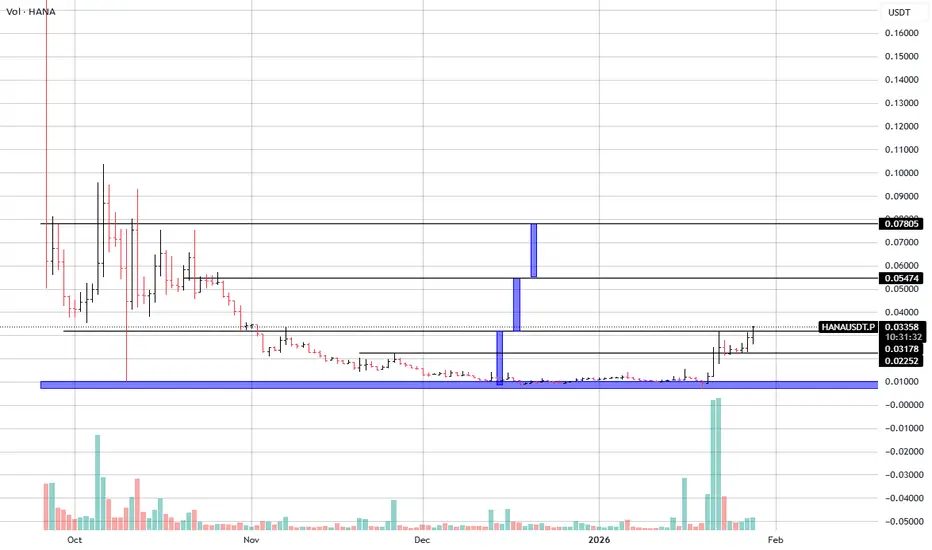 Long
Long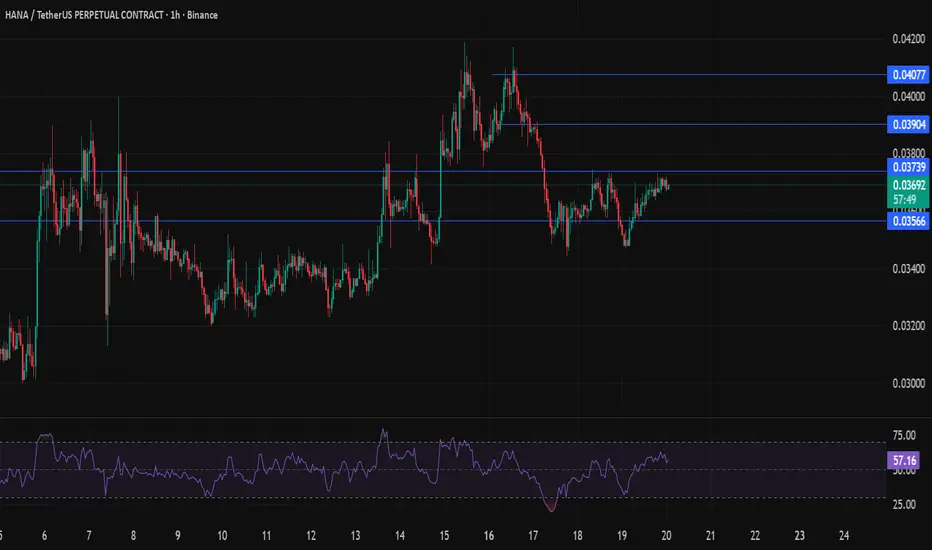
HANA - Descending Trendline Breakout – Potential Impulsive MovePrice has been respecting a long-term descending trendline, forming a clear bearish structure with lower highs. Currently, price is testing this trendline from below after a strong local bounce from support.
If price successfully breaks and holds above the descending trendline, this breakout ma
Long
HANA READY TO FLYListed on top exchanges, technicals bullish, small MCAP and Volume Huge. Be patient and use proper risk management
Long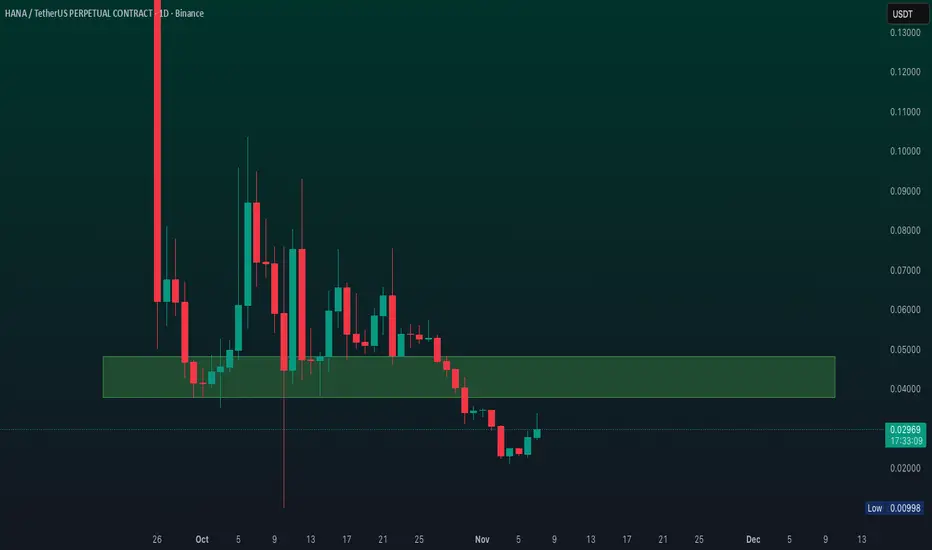
HANAUSDT.P LONG IDEAHİ all, i was watching hanausdt for a while. yellow box seems to me like accoumulationbox and every dip higher from former one. also marketcap of this coin is very very low so i want to try long position on it.
entry : 0.05420
stop : 0.04422
target area : between somewhere 0.07000 - 0.09000
Long
HANA bullrun Another gem in AI sector, once it breaks .09 it will move to .21 fast and once it breaks .21 it will fly like coai and aia
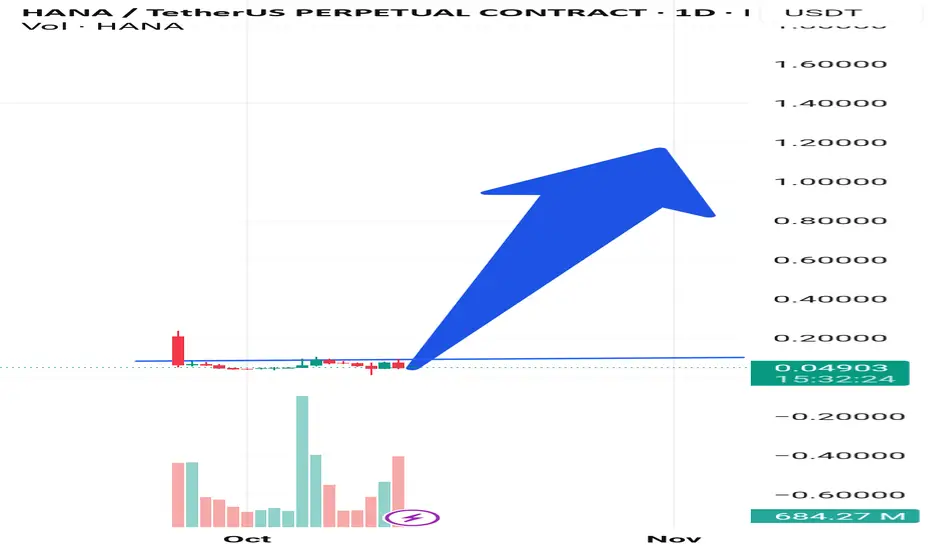
HANA will Become a TOP Performer soon Targeting $1 I am getting a Kind of feeling that HANA will pull COAI kind of Price action, Chart Looks similar like COAI (Before it Pumped from 0.39 to 7$)
I am anticipating that once it Breaks 0.09 Level it will be free ride towards new ATH
break and retest" pattern, targeting higher resistances. Failure belo
Long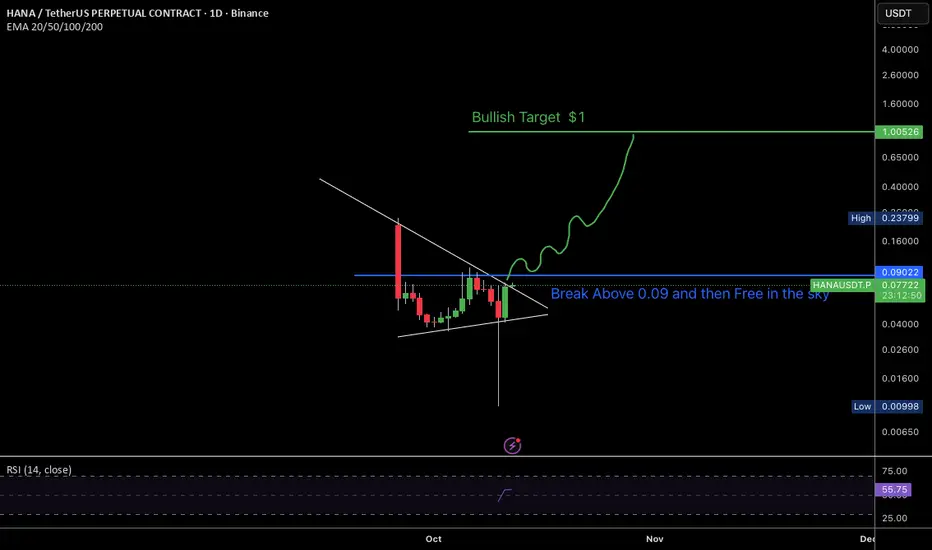
HANA/USDT – 1st Setup Targets Hit, Positioning for 2nd Leg HigheFollowing the success of our first buy setup, where all outlined targets were achieved, HANA is now entering the next accumulation phase, setting the stage for a second bullish setup.
This structure aligns with the classic principle of “buy high, sell higher,” as momentum continues to favor the upsi
Long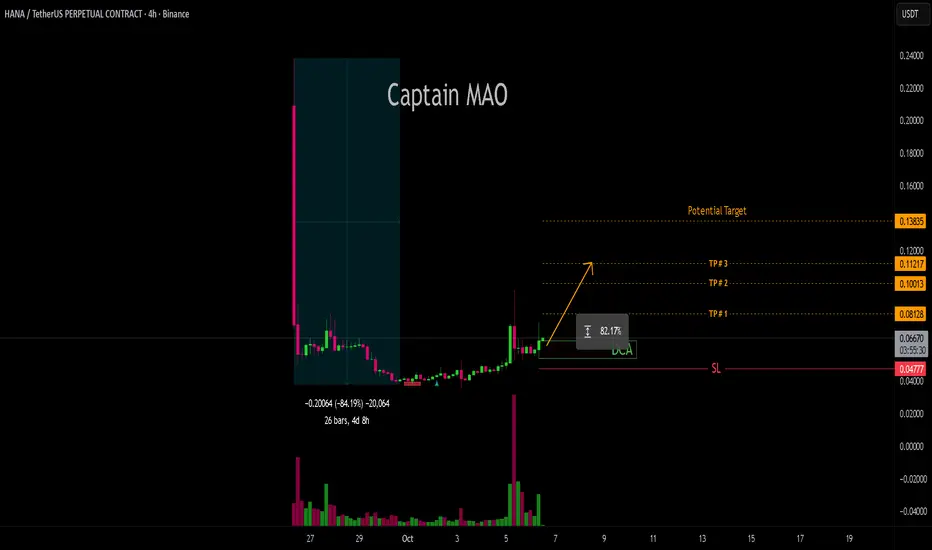
HANA/USDT -85% Drawdown Signals Recovery PotentialAfter suffering a sharp -85% decline from the peak, HANA has finally begun to stabilize, with price action consolidating and forming a strong base of support. This deep reset has cleared paving the way for a potential recovery phase.
The emerging structure suggests accumulation is underway, with b
Long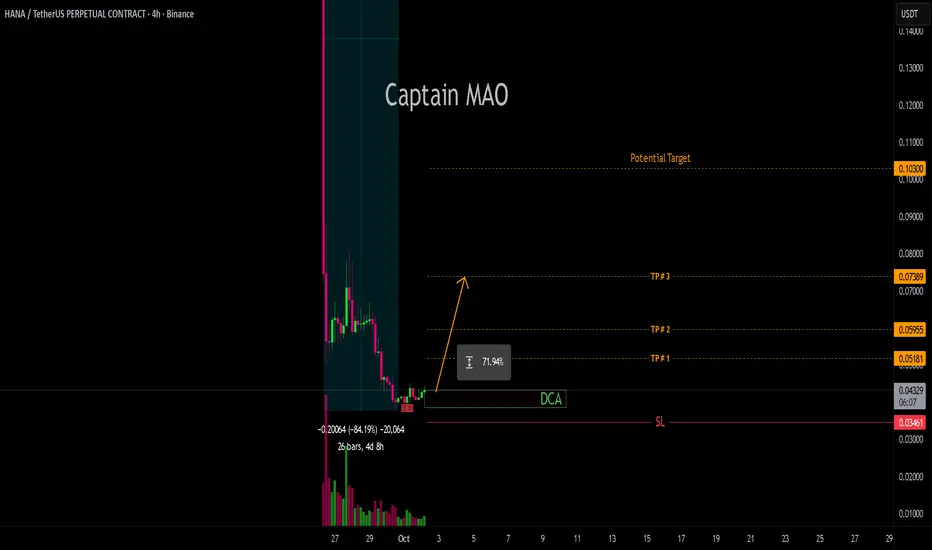
See all ideas
Summarizing what the indicators are suggesting.
Oscillators
Neutral
SellBuy
Strong sellStrong buy
Strong sellSellNeutralBuyStrong buy
Oscillators
Neutral
SellBuy
Strong sellStrong buy
Strong sellSellNeutralBuyStrong buy
Summary
Neutral
SellBuy
Strong sellStrong buy
Strong sellSellNeutralBuyStrong buy
Summary
Neutral
SellBuy
Strong sellStrong buy
Strong sellSellNeutralBuyStrong buy
Summary
Neutral
SellBuy
Strong sellStrong buy
Strong sellSellNeutralBuyStrong buy
Moving Averages
Neutral
SellBuy
Strong sellStrong buy
Strong sellSellNeutralBuyStrong buy
Moving Averages
Neutral
SellBuy
Strong sellStrong buy
Strong sellSellNeutralBuyStrong buy
Displays a symbol's price movements over previous years to identify recurring trends.