
Rev Growth YoY and FWD are 50 and 23% respectively and 307 and 167% above the sector respectively while PE GAAP TTM and FWD are 71 and 65% below sector! This implies a huge discount in growth.
Gross Profit does lag behind the sector by about 12%, but the valuation combined with the outsized growth substantially off-sets this disparity.
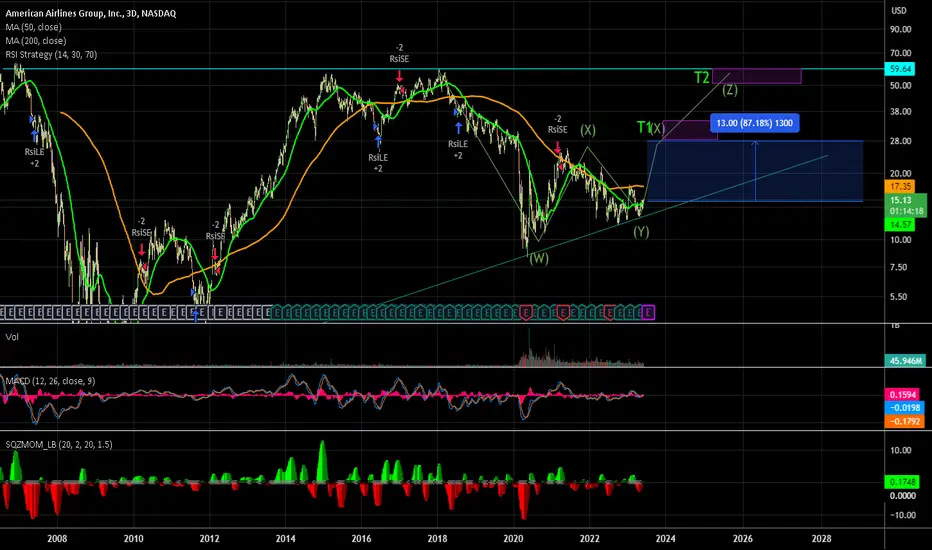
On a technical note, there is an intermediary "W" pattern. Confirmation of this pattern would be realized once the SP closes above the midpoint peak of @25.75 along w/ substantial volume, 3 day rule, etc. Pattern and targets are also correlated with Fibonacci retracement levels and Fib Time series.
Gross Profit does lag behind the sector by about 12%, but the valuation combined with the outsized growth substantially off-sets this disparity.
On a technical note, there is an intermediary "W" pattern. Confirmation of this pattern would be realized once the SP closes above the midpoint peak of @25.75 along w/ substantial volume, 3 day rule, etc. Pattern and targets are also correlated with Fibonacci retracement levels and Fib Time series.

Aviso legal
As informações e publicações não se destinam a ser, e não constituem, conselhos ou recomendações financeiras, de investimento, comerciais ou de outro tipo fornecidos ou endossados pela TradingView. Leia mais nos Termos de Uso.
Aviso legal
As informações e publicações não se destinam a ser, e não constituem, conselhos ou recomendações financeiras, de investimento, comerciais ou de outro tipo fornecidos ou endossados pela TradingView. Leia mais nos Termos de Uso.