
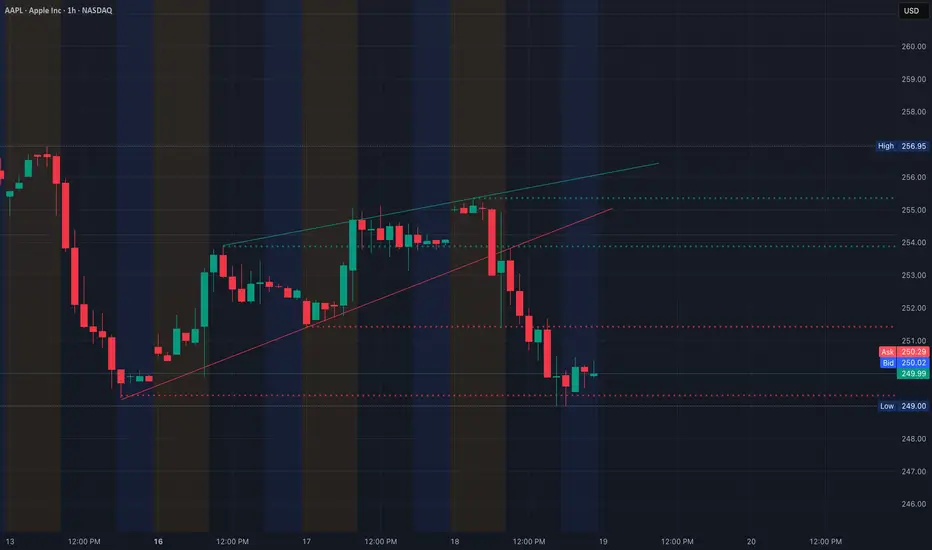
Most traders will look at this and think the short is obvious.
I think the bigger lesson is where the trade is happening.
1H Context (Main Bias)
On the 1H, AAPL is already sitting around the -100% zone of the 7-day ATR.
That matters because ATR is not just about direction. It tells you how much of the expected move has already been used.
What I see on the 1H:
* Price has been trending lower
* Lower highs and lower lows are still intact
* Price remains below the key moving averages
* The move is already stretched into the lower ATR zone
So the higher-timeframe bias is still bearish, but this is no longer an early short location. It is a late-stage bearish move, which means reward starts shrinking and reaction risk starts increasing.
That is the difference between being right on direction and still getting a bad entry.

15M Structure (Execution Layer)
Now dropping into the 15M, the structure helps explain what is happening inside that larger 1H move.
What I see on the 15M:
* Price broke down cleanly from the upper zone
* The downtrend line and lower-high structure stayed in control
* Price pushed into the 249 area and started slowing
* The recent candles are smaller, showing less downside urgency than earlier in the session
This is important.
The 15M is telling me the bears still have control, but momentum is no longer as clean as it was during the earlier breakdown. That is usually where traders get trapped chasing the last part of the move.
So on this timeframe, I am not interested in blindly pressing puts into support after the move is already extended.

GEX Map (Where Price Can React)
Now bring in GEX, because this is where the chart starts making more sense.
Key levels from your GEX:
* 250 = major PUT support
* 245 = lower support / GEX area below
* 260 and above = resistance zone
* 240 zone = major positive net GEX / call resistance area below on the map
What matters most here is that price is sitting right around the 250 support area, while the 1H ATR shows the move is already deep into exhaustion territory.
That combination is the key lesson:
* ATR says the move is stretched
* 15M says momentum is slowing
* GEX says price is sitting on an important reaction level
That is not the place where I want to chase weakness.
Trade Plan
Bearish continuation setup I only want bearish continuation if price can clearly break and hold below 249.80 to 250.
That would open the door toward:
* 248
* then possibly 245 to 246
Invalidation for that idea is price reclaiming above the near-term bounce structure and holding back above 250.80 to 251.
Bullish reaction setup If price holds the 250 area and starts bouncing with strength, then a relief move can develop.
In that case, I would watch for:
* 252
* then 253.5 to 254
But I would still treat that as a counter-trend reaction unless the 1H structure starts improving.
What this teaches
This is exactly why I use all three together.
1H gives me the real bias 15M shows me whether the current move is still clean or starting to stall GEX tells me where price is most likely to react
If you only look at one of them, you miss the full story.
If you only look at direction, you short too late. If you only look at support, you buy too early. If you combine all three, you start trading with context.
My view here
AAPL is still bearish on the main timeframe.
But at this location, I am not interested in emotional chasing.
This is a spot for:
* breakdown confirmation below 250 for continuation or
* a reaction bounce from support
Not random entries in the middle.
Final thought
A lot of traders ask, “Is it going up or down?”
The better question is, “Where are we inside the move?”
That is where timing gets better.
I think the bigger lesson is where the trade is happening.
1H Context (Main Bias)
On the 1H, AAPL is already sitting around the -100% zone of the 7-day ATR.
That matters because ATR is not just about direction. It tells you how much of the expected move has already been used.
What I see on the 1H:
* Price has been trending lower
* Lower highs and lower lows are still intact
* Price remains below the key moving averages
* The move is already stretched into the lower ATR zone
So the higher-timeframe bias is still bearish, but this is no longer an early short location. It is a late-stage bearish move, which means reward starts shrinking and reaction risk starts increasing.
That is the difference between being right on direction and still getting a bad entry.
15M Structure (Execution Layer)
Now dropping into the 15M, the structure helps explain what is happening inside that larger 1H move.
What I see on the 15M:
* Price broke down cleanly from the upper zone
* The downtrend line and lower-high structure stayed in control
* Price pushed into the 249 area and started slowing
* The recent candles are smaller, showing less downside urgency than earlier in the session
This is important.
The 15M is telling me the bears still have control, but momentum is no longer as clean as it was during the earlier breakdown. That is usually where traders get trapped chasing the last part of the move.
So on this timeframe, I am not interested in blindly pressing puts into support after the move is already extended.
GEX Map (Where Price Can React)
Now bring in GEX, because this is where the chart starts making more sense.
Key levels from your GEX:
* 250 = major PUT support
* 245 = lower support / GEX area below
* 260 and above = resistance zone
* 240 zone = major positive net GEX / call resistance area below on the map
What matters most here is that price is sitting right around the 250 support area, while the 1H ATR shows the move is already deep into exhaustion territory.
That combination is the key lesson:
* ATR says the move is stretched
* 15M says momentum is slowing
* GEX says price is sitting on an important reaction level
That is not the place where I want to chase weakness.
Trade Plan
Bearish continuation setup I only want bearish continuation if price can clearly break and hold below 249.80 to 250.
That would open the door toward:
* 248
* then possibly 245 to 246
Invalidation for that idea is price reclaiming above the near-term bounce structure and holding back above 250.80 to 251.
Bullish reaction setup If price holds the 250 area and starts bouncing with strength, then a relief move can develop.
In that case, I would watch for:
* 252
* then 253.5 to 254
But I would still treat that as a counter-trend reaction unless the 1H structure starts improving.
What this teaches
This is exactly why I use all three together.
1H gives me the real bias 15M shows me whether the current move is still clean or starting to stall GEX tells me where price is most likely to react
If you only look at one of them, you miss the full story.
If you only look at direction, you short too late. If you only look at support, you buy too early. If you combine all three, you start trading with context.
My view here
AAPL is still bearish on the main timeframe.
But at this location, I am not interested in emotional chasing.
This is a spot for:
* breakdown confirmation below 250 for continuation or
* a reaction bounce from support
Not random entries in the middle.
Final thought
A lot of traders ask, “Is it going up or down?”
The better question is, “Where are we inside the move?”
That is where timing gets better.

Built for traders who want clarity, not noise.
bullbearxinsights.app
bullbearxinsights.app
Aviso legal
As informações e publicações não se destinam a ser, e não constituem, conselhos ou recomendações financeiras, de investimento, comerciais ou de outro tipo fornecidos ou endossados pela TradingView. Leia mais nos Termos de Uso.
Built for traders who want clarity, not noise.
bullbearxinsights.app
bullbearxinsights.app
Aviso legal
As informações e publicações não se destinam a ser, e não constituem, conselhos ou recomendações financeiras, de investimento, comerciais ou de outro tipo fornecidos ou endossados pela TradingView. Leia mais nos Termos de Uso.