
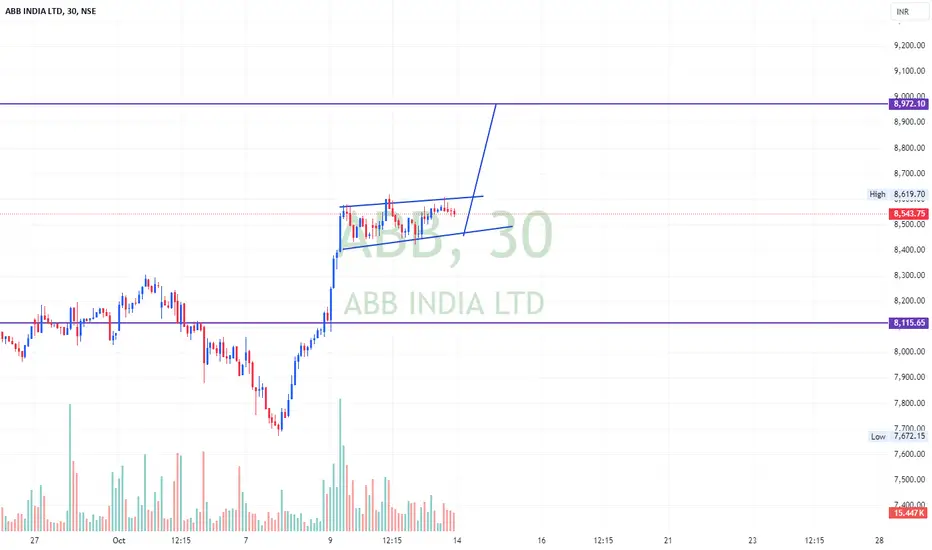
The chart shows a strong upward trend in ABB India Ltd, with a recent consolidation forming a rising wedge pattern. This pattern typically indicates a potential breakout. The price is currently testing the upper boundary of the wedge, suggesting a possible bullish breakout if it surpasses the resistance level around 8,619.70 INR.
Key Levels:
Resistance: 8,972.10 INR
Support: 8,115.65 INR
Potential Trade Idea:
Bullish Scenario: A breakout above 8,619.70 INR could lead to a rally towards the next resistance at 8,972.10 INR.
Bearish Scenario: If the price fails to break out and falls below the wedge, watch for support at 8,115.65 INR.
Key Levels:
Resistance: 8,972.10 INR
Support: 8,115.65 INR
Potential Trade Idea:
Bullish Scenario: A breakout above 8,619.70 INR could lead to a rally towards the next resistance at 8,972.10 INR.
Bearish Scenario: If the price fails to break out and falls below the wedge, watch for support at 8,115.65 INR.

Aviso legal
As informações e publicações não se destinam a ser, e não constituem, conselhos ou recomendações financeiras, de investimento, comerciais ou de outro tipo fornecidos ou endossados pela TradingView. Leia mais nos Termos de Uso.
Aviso legal
As informações e publicações não se destinam a ser, e não constituem, conselhos ou recomendações financeiras, de investimento, comerciais ou de outro tipo fornecidos ou endossados pela TradingView. Leia mais nos Termos de Uso.