Continuation via Symmetrical Triangle
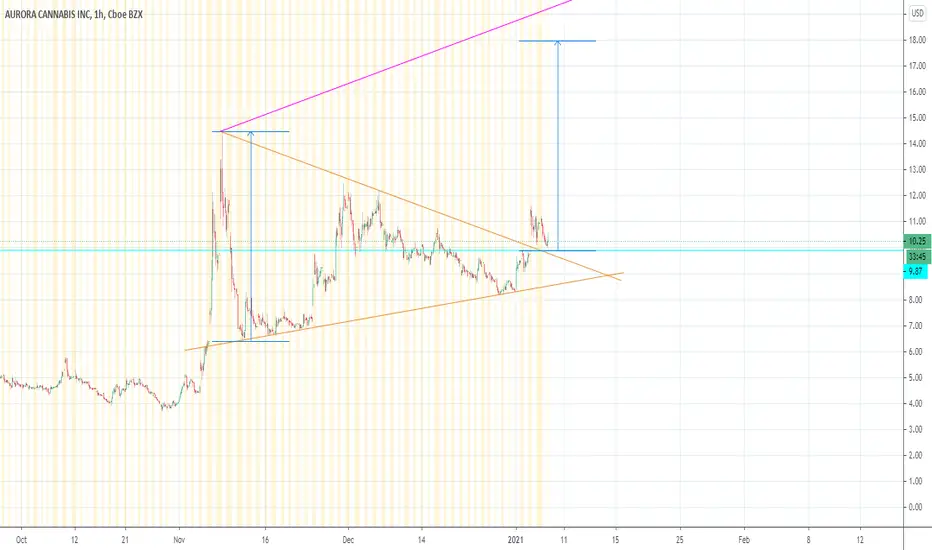
Hourly chart showing ACB making higher lows and lower highs to form a symmetrical triangle. Potential trend continuation following a breakout of the triangle, and back test of the upper trendline of the triangle. See SunRun,  RUN for a similar setup and how it can play out. GLTA!
Aviso legal
As informações e publicações não se destinam a ser, e não constituem, conselhos ou recomendações financeiras, de investimento, comerciais ou de outro tipo fornecidos ou endossados pela TradingView. Leia mais nos Termos de Uso.
Aviso legal
As informações e publicações não se destinam a ser, e não constituem, conselhos ou recomendações financeiras, de investimento, comerciais ou de outro tipo fornecidos ou endossados pela TradingView. Leia mais nos Termos de Uso.