
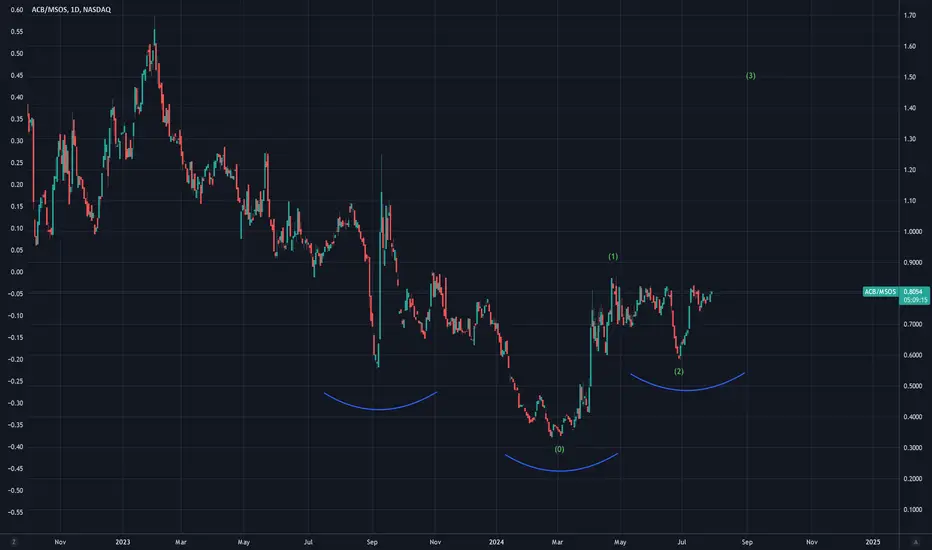
ACB chart itself looks bullish, but the ACB/MSOS spread shows a cleaner set of waves to predict the movement.
Buy ACB as long as it is more bullish than MSOS. This thinking applies to any stock compared to a related ETF or index.
Buy ACB as long as it is more bullish than MSOS. This thinking applies to any stock compared to a related ETF or index.
Nota
MSOS great recovery off the recession worry lows yesterday. Still a long way but moving up in the same direction to 1.25 to 1.5x MSOS, do the math.
Aviso legal
As informações e publicações não se destinam a ser, e não constituem, conselhos ou recomendações financeiras, de investimento, comerciais ou de outro tipo fornecidos ou endossados pela TradingView. Leia mais nos Termos de Uso.
Aviso legal
As informações e publicações não se destinam a ser, e não constituem, conselhos ou recomendações financeiras, de investimento, comerciais ou de outro tipo fornecidos ou endossados pela TradingView. Leia mais nos Termos de Uso.