
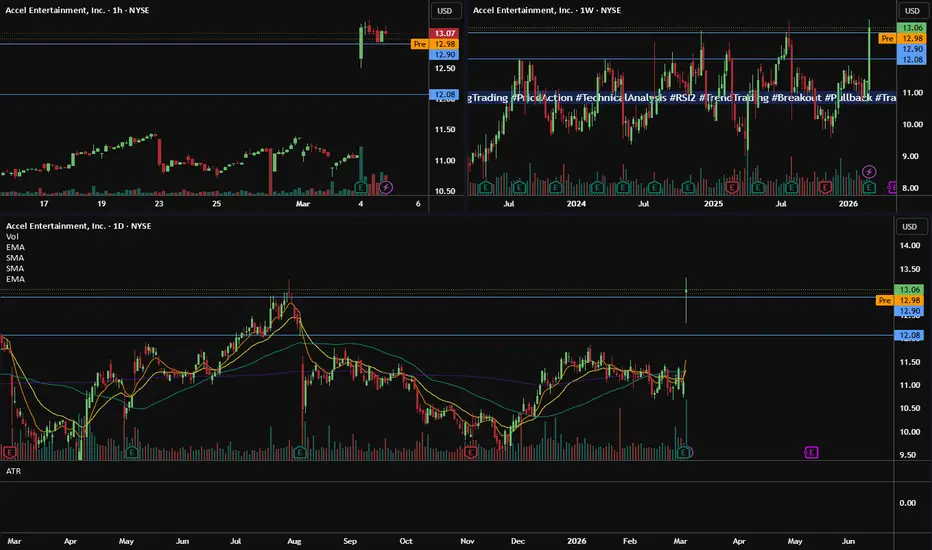
💰 ACEL — Swing Trade Idea
( Accel Entertainment Inc. )
🏢 Company Snapshot
• Operates distributed gaming terminals, slot routes, and gaming locations across multiple U.S. states.
• Revenue driven by recurring gaming activity and expansion of terminal networks.
• Stock is pushing a multi-month range breakout attempt, attracting momentum traders.
📊 Fundamental Context (Trade-Relevant Only)
Valuation
• Trades at a mid-range P/E vs regional gaming peers — not deep value but not stretched relative to growth.
Balance Sheet
• Debt is present due to gaming terminal expansion but manageable relative to cash flow.
Cash Flow
• Strong operating cash flow from recurring gaming revenue; margins remain stable.
Dividend
• Not a primary driver — capital mostly reinvested for expansion.
Fundamental Read:
Stable cash generation and steady terminal expansion support trend continuation if price breaks the multi-year range highs.
🪙 Industry & Sector Backdrop
Short-Term (1–4 weeks)
• Small/mid-cap consumer discretionary names seeing selective momentum rotations.
Medium-Term (1–6 months)
• Regional gaming operators showing relative strength vs small-cap indices.
Macro Influence
• Consumer discretionary spending and regional gaming demand remain stable despite rate pressure.
Sector Bias: Neutral → Slightly Bullish
📐 Technical Structure (Primary Driver)
Trend
• Price above 50-SMA (~11.5)
• Price above 200-SMA (~11.2)
• Trend structure: higher lows forming since December
Momentum
• RSI extremely extended (>90) on the current breakout impulse
• Short-term mean reversion likely before continuation
Pattern
• Range compression breakout attempt from the $11–$13 multi-month range
Volume
• Breakout candle printed significant expansion in volume, indicating institutional participation.
Key Levels
Support
• 12.40 – 12.60 (breakout retest zone)
• 11.20 – 11.50 (trend support + moving averages)
Resistance
• 13.10 – 13.30 (range highs / breakout trigger)
• 14.20 – 14.50 (measured move projection)
🎯 Trade Plan (Execution-Focused)
Entry
• 12.50 – 12.80
Pullback into breakout retest where momentum resets.
Stop
• 12.05
Below structure and failed breakout zone.
Target
• 14.30
Risk-to-Reward
• ≈ 2.4R
Alternate Scenario
If price breaks and holds above 13.30 with volume, momentum traders may chase continuation.
Breakout Entry: 13.35
Stop: 12.70
Target: 15.00 measured expansion.
🧠 Swing Trader’s Bias
Price is attempting a high-timeframe range breakout while maintaining a strong trend above the 50- and 200-SMA. Momentum is currently stretched, so the preferred setup is a controlled pullback into the 12.5 zone before continuation toward the $14 area.
Failure to hold 12.10 support would invalidate the breakout thesis and signal a return to the broader trading range.
( Accel Entertainment Inc. )
🏢 Company Snapshot
• Operates distributed gaming terminals, slot routes, and gaming locations across multiple U.S. states.
• Revenue driven by recurring gaming activity and expansion of terminal networks.
• Stock is pushing a multi-month range breakout attempt, attracting momentum traders.
📊 Fundamental Context (Trade-Relevant Only)
Valuation
• Trades at a mid-range P/E vs regional gaming peers — not deep value but not stretched relative to growth.
Balance Sheet
• Debt is present due to gaming terminal expansion but manageable relative to cash flow.
Cash Flow
• Strong operating cash flow from recurring gaming revenue; margins remain stable.
Dividend
• Not a primary driver — capital mostly reinvested for expansion.
Fundamental Read:
Stable cash generation and steady terminal expansion support trend continuation if price breaks the multi-year range highs.
🪙 Industry & Sector Backdrop
Short-Term (1–4 weeks)
• Small/mid-cap consumer discretionary names seeing selective momentum rotations.
Medium-Term (1–6 months)
• Regional gaming operators showing relative strength vs small-cap indices.
Macro Influence
• Consumer discretionary spending and regional gaming demand remain stable despite rate pressure.
Sector Bias: Neutral → Slightly Bullish
📐 Technical Structure (Primary Driver)
Trend
• Price above 50-SMA (~11.5)
• Price above 200-SMA (~11.2)
• Trend structure: higher lows forming since December
Momentum
• RSI extremely extended (>90) on the current breakout impulse
• Short-term mean reversion likely before continuation
Pattern
• Range compression breakout attempt from the $11–$13 multi-month range
Volume
• Breakout candle printed significant expansion in volume, indicating institutional participation.
Key Levels
Support
• 12.40 – 12.60 (breakout retest zone)
• 11.20 – 11.50 (trend support + moving averages)
Resistance
• 13.10 – 13.30 (range highs / breakout trigger)
• 14.20 – 14.50 (measured move projection)
🎯 Trade Plan (Execution-Focused)
Entry
• 12.50 – 12.80
Pullback into breakout retest where momentum resets.
Stop
• 12.05
Below structure and failed breakout zone.
Target
• 14.30
Risk-to-Reward
• ≈ 2.4R
Alternate Scenario
If price breaks and holds above 13.30 with volume, momentum traders may chase continuation.
Breakout Entry: 13.35
Stop: 12.70
Target: 15.00 measured expansion.
🧠 Swing Trader’s Bias
Price is attempting a high-timeframe range breakout while maintaining a strong trend above the 50- and 200-SMA. Momentum is currently stretched, so the preferred setup is a controlled pullback into the 12.5 zone before continuation toward the $14 area.
Failure to hold 12.10 support would invalidate the breakout thesis and signal a return to the broader trading range.

ClearPoint Trading 🎯
Indicators • Education • Execution
whop.com/clearpointtrading | discord.gg/8sEwMnpz
Indicators • Education • Execution
whop.com/clearpointtrading | discord.gg/8sEwMnpz
Aviso legal
As informações e publicações não se destinam a ser, e não constituem, conselhos ou recomendações financeiras, de investimento, comerciais ou de outro tipo fornecidos ou endossados pela TradingView. Leia mais nos Termos de Uso.
ClearPoint Trading 🎯
Indicators • Education • Execution
whop.com/clearpointtrading | discord.gg/8sEwMnpz
Indicators • Education • Execution
whop.com/clearpointtrading | discord.gg/8sEwMnpz
Aviso legal
As informações e publicações não se destinam a ser, e não constituem, conselhos ou recomendações financeiras, de investimento, comerciais ou de outro tipo fornecidos ou endossados pela TradingView. Leia mais nos Termos de Uso.