
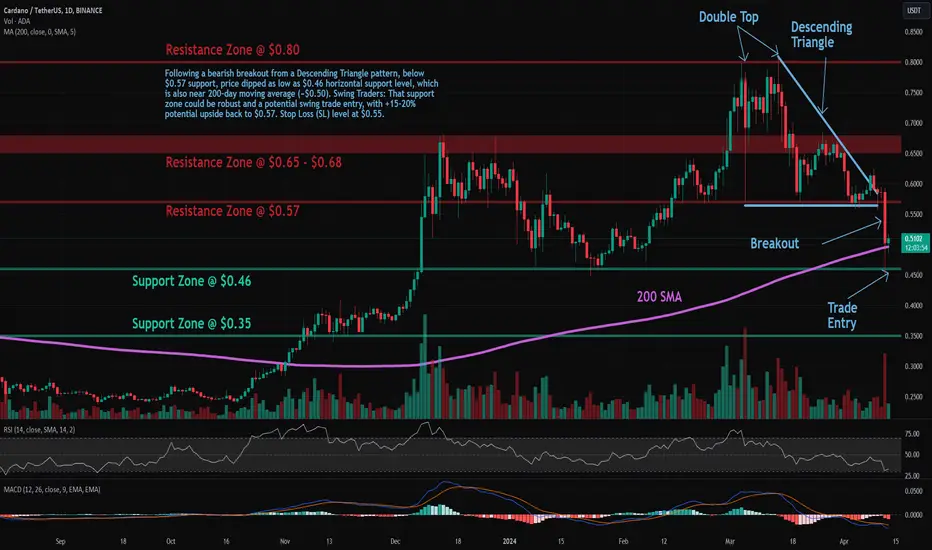
Trade setup: Trends are mixed. Following a bearish breakout from a Descending Triangle pattern, below $0.57 support, price dipped as low as $0.46 horizontal support level, which is also near 200-day moving average (~$0.50). Swing Traders:That support zone could be robust and a potential swing trade entry, with +15-20% potential upside back to $0.57. Stop Loss (SL) level at $0.55.
Pattern: Price is trading in a Descending Triangle pattern. Typically, a breakout will occur in the direction of the existing trend.
Trend: Downtrend on Short- and Medium-Term basis and Uptrend on Long-Term basis.
Momentum is Bearish (MACD Line is below MACD Signal Line, and RSI is below 45).
Support and Resistance: Nearest Support Zone is $0.46, then $0.35. The nearest Resistance Zone is $0.57 (previous support), then $0.65 - $0.68, and $0.80.

Aviso legal
As informações e publicações não se destinam a ser, e não constituem, conselhos ou recomendações financeiras, de investimento, comerciais ou de outro tipo fornecidos ou endossados pela TradingView. Leia mais nos Termos de Uso.
Aviso legal
As informações e publicações não se destinam a ser, e não constituem, conselhos ou recomendações financeiras, de investimento, comerciais ou de outro tipo fornecidos ou endossados pela TradingView. Leia mais nos Termos de Uso.