#ADA/USDT
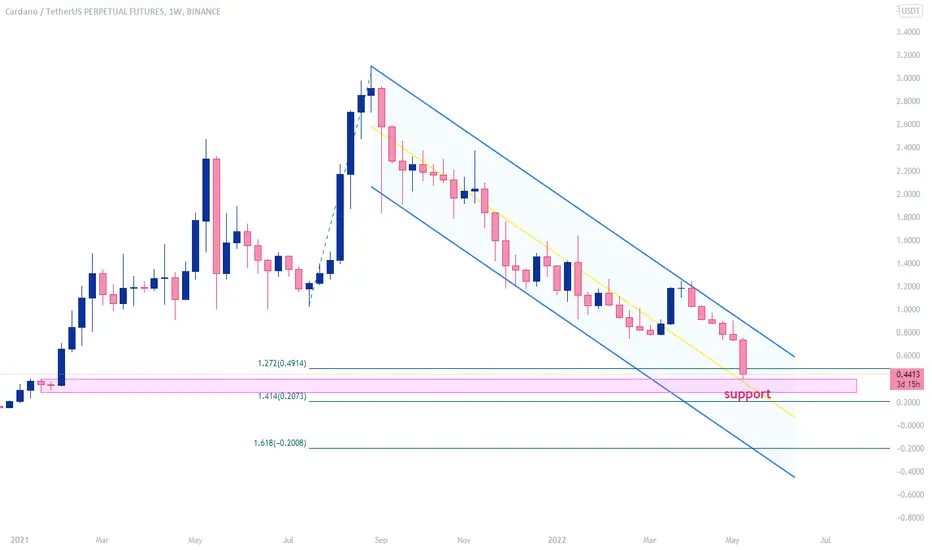
 ADA weekly chart shows price is above middle line of descending channel that is the same with long term support zone.
this support zone is between 1.272 and 1.414 fib level of last weekly swing high.
🐻 if price break down from 1.414 fib level it will continue its downtrend to lower line of channel that is the same with 1.618 fib level which is below $0😁!!
🐮 so price should hold this support and maybe in short term or mid term it has sideways moves to help bulls gather strength, and start a new rally in long term.

ADA weekly chart shows price is above middle line of descending channel that is the same with long term support zone.this support zone is between 1.272 and 1.414 fib level of last weekly swing high.
🐻 if price break down from 1.414 fib level it will continue its downtrend to lower line of channel that is the same with 1.618 fib level which is below $0😁!!
🐮 so price should hold this support and maybe in short term or mid term it has sideways moves to help bulls gather strength, and start a new rally in long term.

Aviso legal
As informações e publicações não se destinam a ser, e não constituem, conselhos ou recomendações financeiras, de investimento, comerciais ou de outro tipo fornecidos ou endossados pela TradingView. Leia mais nos Termos de Uso.
Aviso legal
As informações e publicações não se destinam a ser, e não constituem, conselhos ou recomendações financeiras, de investimento, comerciais ou de outro tipo fornecidos ou endossados pela TradingView. Leia mais nos Termos de Uso.