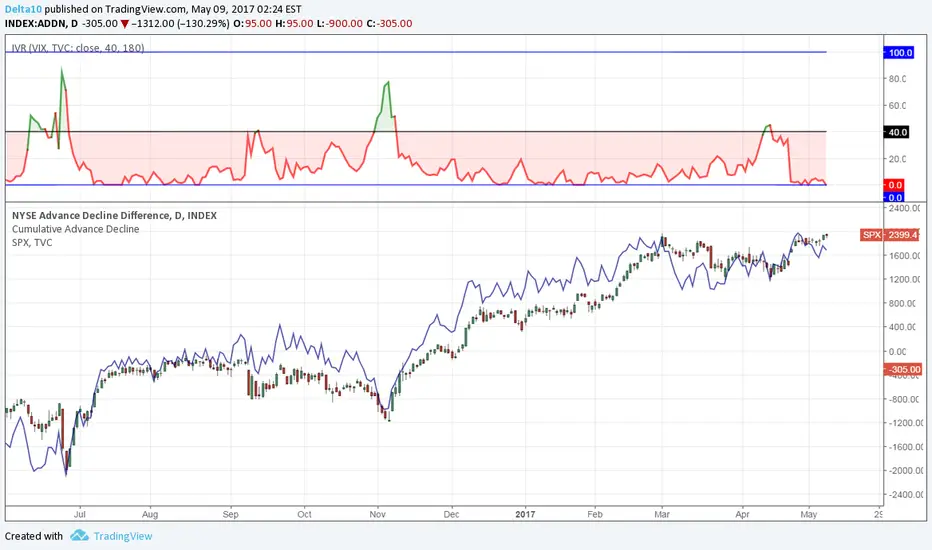
The charts shows that AdvanceDecline Line and VIX are showing the tops and bottoms of S&P price movement. You'll also notice, that ADL is changing direction a few days before the S&P 500 follows. VIX shows how "deep" the correction will be and when it ends.

Aviso legal
As informações e publicações não se destinam a ser, e não constituem, conselhos ou recomendações financeiras, de investimento, comerciais ou de outro tipo fornecidos ou endossados pela TradingView. Leia mais nos Termos de Uso.
Aviso legal
As informações e publicações não se destinam a ser, e não constituem, conselhos ou recomendações financeiras, de investimento, comerciais ou de outro tipo fornecidos ou endossados pela TradingView. Leia mais nos Termos de Uso.