
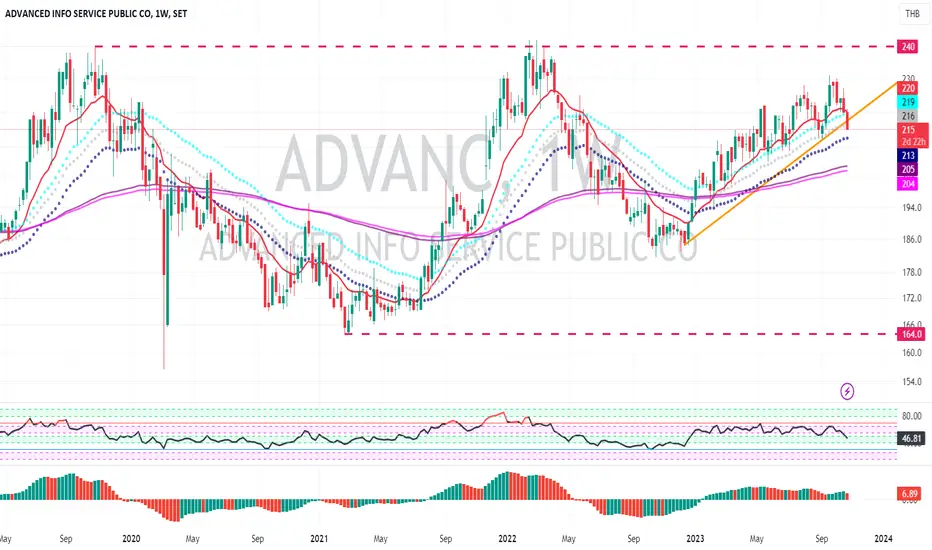
ADVANC , Week Chart , have been sideway in the trading range since 2020
and this week is the first week that price start reverse down and break out the trendline.
RSI and AO show weak momentum signal.
We should monitor how deep that this chart go down by using the daily chart to monitor more detail.
and this week is the first week that price start reverse down and break out the trendline.
RSI and AO show weak momentum signal.
We should monitor how deep that this chart go down by using the daily chart to monitor more detail.

Pragasit Thitaram, CEWA
Aviso legal
As informações e publicações não se destinam a ser, e não constituem, conselhos ou recomendações financeiras, de investimento, comerciais ou de outro tipo fornecidos ou endossados pela TradingView. Leia mais nos Termos de Uso.
Pragasit Thitaram, CEWA
Aviso legal
As informações e publicações não se destinam a ser, e não constituem, conselhos ou recomendações financeiras, de investimento, comerciais ou de outro tipo fornecidos ou endossados pela TradingView. Leia mais nos Termos de Uso.