
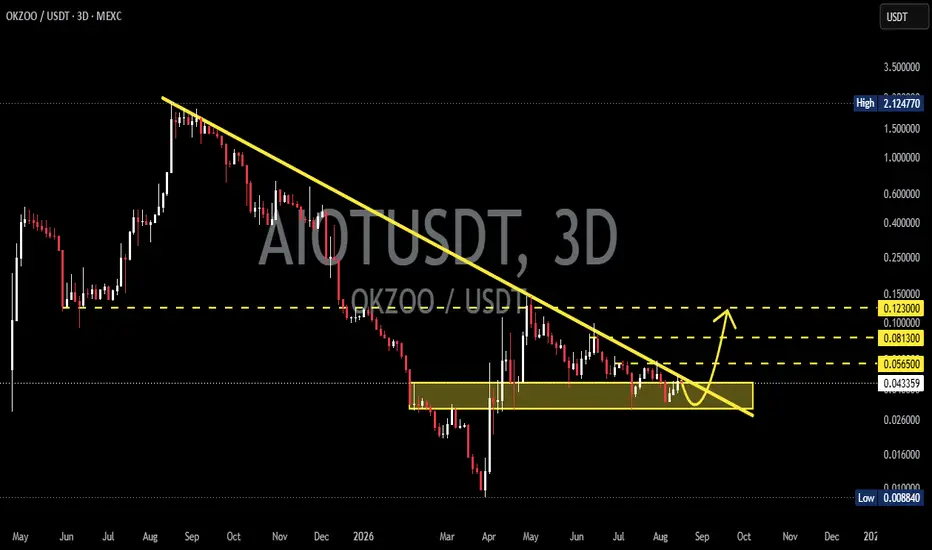
📊 Technical Analysis — 3D Chart
💵 Coin: $OKZOO / USDT
⏳ Time Frame: 3D
📉 Pattern: Long-Term Descending Trendline + Major Support Zone
🟨 Key Support Zone: 0.04335 – 0.03030
🎯 Key Resistance: 0.05650 → 0.08130 → 0.12300
---
🔻 Market Structure
$OKZOO remains inside a long-term bearish structure, with price consistently forming lower highs beneath the descending yellow trendline.
📉 The descending trendline has acted as dynamic resistance, repeatedly rejecting bullish attempts to recover.
However, price is now trading directly around a major yellow support/demand zone at 0.04335–0.03030, making this an important area to watch for a potential reaction.
🟨 This zone could become a base for accumulation and recovery if buyers manage to defend it.
---
🟨 Key Support Zone — 0.04335–0.03030
The yellow block represents the most important support area on this chart.
🛡️ 0.04335 is the upper boundary of the zone.
🛡️ 0.03030 is the lower boundary.
If buyers continue defending this area, price could attempt another recovery toward the descending trendline.
⚠️ A decisive breakdown below 0.03030 would weaken the bullish recovery thesis and could expose price to further downside.
---
🟢 Bullish Scenario
The bullish setup becomes more interesting if $OKZOO continues to hold the 0.04335–0.03030 support zone.
🚀 Step 1: Buyers defend the yellow support zone.
📈 Step 2: Price breaks above the descending trendline.
🔥 Step 3: A strong 3D close above the trendline confirms a potential momentum shift.
If the breakout is confirmed, the next important upside levels are:
🎯 0.05650 — First resistance / upside objective
🎯 0.08130 — Major resistance
🎯 0.12300 — Higher resistance and potential extended recovery zone
A successful breakout above the descending trendline would be particularly significant because it could signal the first major structural improvement after a prolonged bearish trend.
---
🔴 Bearish Scenario
The bearish structure remains valid as long as price stays below the descending trendline.
⚠️ If $OKZOO gets rejected from the trendline and fails to reclaim 0.05650, sellers could remain in control.
📉 A break below the 0.04335–0.03030 support zone would be a major warning signal.
💥 A decisive loss of 0.03030 could invalidate the current support-based recovery setup and potentially lead to another leg lower.
---
🔎 What to Watch
👀 0.04335–0.03030 → Major support / demand zone
👀 Descending Trendline → Main dynamic resistance
👀 0.05650 → First important breakout confirmation area
👀 0.08130 → Major resistance
👀 0.12300 → Higher recovery target area
📌 Key confirmation: The most important signal is not simply a wick above the trendline, but a strong 3D candle close above it, preferably followed by a successful retest.
---
🧠 Conclusion
$OKZOO is approaching a critical decision zone.
📉 The overall structure remains bearish because the descending trendline is still intact.
🟨 However, price is sitting near the 0.04335–0.03030 support zone, where buyers could potentially attempt to establish a bottom.
🟢 Bullish: Hold the support → break the descending trendline → reclaim 0.05650 → potential move toward 0.08130 and 0.12300.
🔴 Bearish: Rejection from the trendline → loss of 0.04335–0.03030 → bearish continuation.
🔥 The breakout or breakdown from this structure could determine the next major move for $OKZOO.
⚠️ This is technical analysis, not financial advice. Always do your own research and manage risk carefully.
#OKZOO #OKZOOUSDT #OKZOOUSDT #Crypto #Cryptocurrency #Altcoins #CryptoTrading #TechnicalAnalysis #PriceAction #Bullish #Bearish #Breakout #Support #Resistance #Trendline #CryptoAnalysis #AltcoinAnalysis
💵 Coin: $OKZOO / USDT
⏳ Time Frame: 3D
📉 Pattern: Long-Term Descending Trendline + Major Support Zone
🟨 Key Support Zone: 0.04335 – 0.03030
🎯 Key Resistance: 0.05650 → 0.08130 → 0.12300
---
🔻 Market Structure
$OKZOO remains inside a long-term bearish structure, with price consistently forming lower highs beneath the descending yellow trendline.
📉 The descending trendline has acted as dynamic resistance, repeatedly rejecting bullish attempts to recover.
However, price is now trading directly around a major yellow support/demand zone at 0.04335–0.03030, making this an important area to watch for a potential reaction.
🟨 This zone could become a base for accumulation and recovery if buyers manage to defend it.
---
🟨 Key Support Zone — 0.04335–0.03030
The yellow block represents the most important support area on this chart.
🛡️ 0.04335 is the upper boundary of the zone.
🛡️ 0.03030 is the lower boundary.
If buyers continue defending this area, price could attempt another recovery toward the descending trendline.
⚠️ A decisive breakdown below 0.03030 would weaken the bullish recovery thesis and could expose price to further downside.
---
🟢 Bullish Scenario
The bullish setup becomes more interesting if $OKZOO continues to hold the 0.04335–0.03030 support zone.
🚀 Step 1: Buyers defend the yellow support zone.
📈 Step 2: Price breaks above the descending trendline.
🔥 Step 3: A strong 3D close above the trendline confirms a potential momentum shift.
If the breakout is confirmed, the next important upside levels are:
🎯 0.05650 — First resistance / upside objective
🎯 0.08130 — Major resistance
🎯 0.12300 — Higher resistance and potential extended recovery zone
A successful breakout above the descending trendline would be particularly significant because it could signal the first major structural improvement after a prolonged bearish trend.
---
🔴 Bearish Scenario
The bearish structure remains valid as long as price stays below the descending trendline.
⚠️ If $OKZOO gets rejected from the trendline and fails to reclaim 0.05650, sellers could remain in control.
📉 A break below the 0.04335–0.03030 support zone would be a major warning signal.
💥 A decisive loss of 0.03030 could invalidate the current support-based recovery setup and potentially lead to another leg lower.
---
🔎 What to Watch
👀 0.04335–0.03030 → Major support / demand zone
👀 Descending Trendline → Main dynamic resistance
👀 0.05650 → First important breakout confirmation area
👀 0.08130 → Major resistance
👀 0.12300 → Higher recovery target area
📌 Key confirmation: The most important signal is not simply a wick above the trendline, but a strong 3D candle close above it, preferably followed by a successful retest.
---
🧠 Conclusion
$OKZOO is approaching a critical decision zone.
📉 The overall structure remains bearish because the descending trendline is still intact.
🟨 However, price is sitting near the 0.04335–0.03030 support zone, where buyers could potentially attempt to establish a bottom.
🟢 Bullish: Hold the support → break the descending trendline → reclaim 0.05650 → potential move toward 0.08130 and 0.12300.
🔴 Bearish: Rejection from the trendline → loss of 0.04335–0.03030 → bearish continuation.
🔥 The breakout or breakdown from this structure could determine the next major move for $OKZOO.
⚠️ This is technical analysis, not financial advice. Always do your own research and manage risk carefully.
#OKZOO #OKZOOUSDT #OKZOOUSDT #Crypto #Cryptocurrency #Altcoins #CryptoTrading #TechnicalAnalysis #PriceAction #Bullish #Bearish #Breakout #Support #Resistance #Trendline #CryptoAnalysis #AltcoinAnalysis

✅ Get Free Signals! Join Our Telegram Channel Here: t.me/TheCryptoNuclear
✅ Twitter: twitter.com/crypto_nuclear
✅ Join Bybit : partner.bybit.com/b/nuclearvip
✅ Benefits : Lifetime Trading Fee Discount -50%
✅ Twitter: twitter.com/crypto_nuclear
✅ Join Bybit : partner.bybit.com/b/nuclearvip
✅ Benefits : Lifetime Trading Fee Discount -50%
Aviso legal
As informações e publicações não se destinam a ser, e não constituem, conselhos ou recomendações financeiras, de investimento, comerciais ou de outro tipo fornecidos ou endossados pela TradingView. Leia mais nos Termos de Uso.
✅ Get Free Signals! Join Our Telegram Channel Here: t.me/TheCryptoNuclear
✅ Twitter: twitter.com/crypto_nuclear
✅ Join Bybit : partner.bybit.com/b/nuclearvip
✅ Benefits : Lifetime Trading Fee Discount -50%
✅ Twitter: twitter.com/crypto_nuclear
✅ Join Bybit : partner.bybit.com/b/nuclearvip
✅ Benefits : Lifetime Trading Fee Discount -50%
Aviso legal
As informações e publicações não se destinam a ser, e não constituem, conselhos ou recomendações financeiras, de investimento, comerciais ou de outro tipo fornecidos ou endossados pela TradingView. Leia mais nos Termos de Uso.