
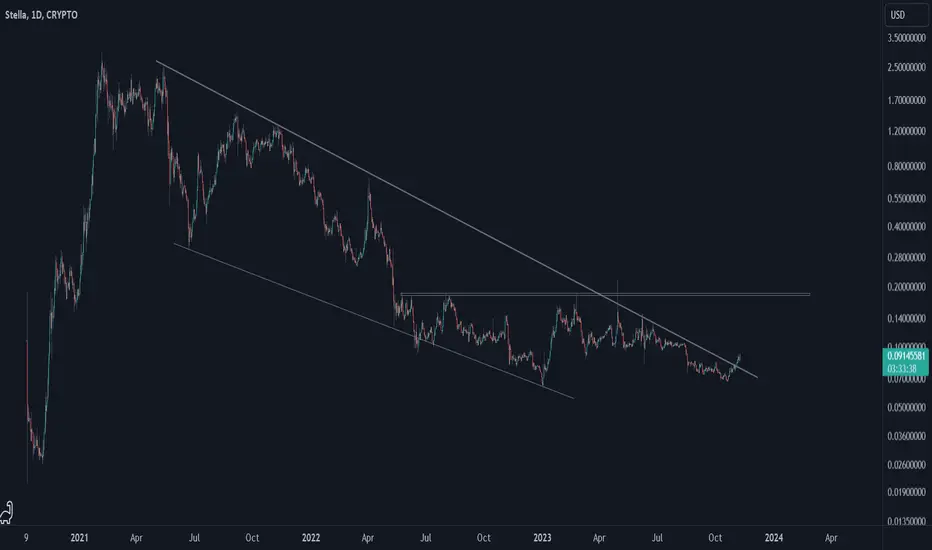
Stella's chart is straightforward; a sharp upward move followed by a lengthy correction wave unfolded in a big descending triangle pattern. Recently, ALPHA broke the major downtrend line. Let's see how up Stella can go.
Nota
Alpha is going crazy!
Nota
So, after Alpha frenzy ended, price came down. Alpha need to break this major horizontal resistance area in order to confirm reversal. Let's see what happens.
Nota
So, Alpha couldn't break the major horizontal resistance area, then went down. It seems Alpha has made an inverted wedge/triangle pattern. Recently, Alpha reached the bottom and then broke the downtrend line. Let's see if Alpha can reach the inverted pattern's top or even break it.
Trade ativo
So, Alpha is going up toward the inverted wedge's upper line. Let's see what happens.

Aviso legal
As informações e publicações não se destinam a ser, e não constituem, conselhos ou recomendações financeiras, de investimento, comerciais ou de outro tipo fornecidos ou endossados pela TradingView. Leia mais nos Termos de Uso.
Aviso legal
As informações e publicações não se destinam a ser, e não constituem, conselhos ou recomendações financeiras, de investimento, comerciais ou de outro tipo fornecidos ou endossados pela TradingView. Leia mais nos Termos de Uso.