
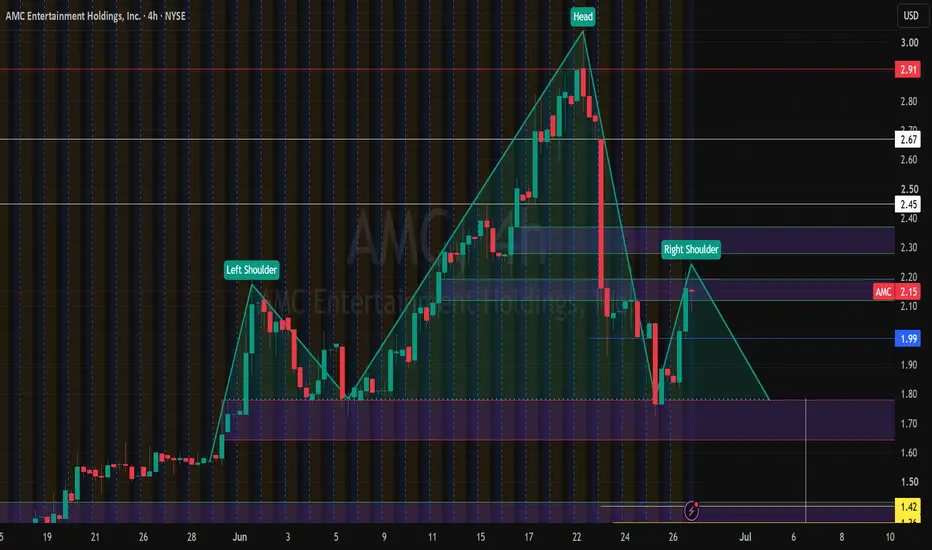
The Head & Shoulders pattern is a key chart formation in technical analysis that signals a potential market reversal from an uptrend to a downtrend. It consists of three peaks: a higher middle peak (the "head") flanked by two lower peaks (the "shoulders") and a support line called the "neckline." Traders use this pattern to:
Identify Reversals: Signals a shift from bullish to bearish trends.
Set Entry Points: A break below the neckline indicates a trading opportunity.
Manage Risk: Stop-loss orders are placed above the shoulders or head.
Estimate Targets: Pattern height helps calculate potential price moves.
Identify Reversals: Signals a shift from bullish to bearish trends.
Set Entry Points: A break below the neckline indicates a trading opportunity.
Manage Risk: Stop-loss orders are placed above the shoulders or head.
Estimate Targets: Pattern height helps calculate potential price moves.

LUIS
Aviso legal
As informações e publicações não se destinam a ser, e não constituem, conselhos ou recomendações financeiras, de investimento, comerciais ou de outro tipo fornecidos ou endossados pela TradingView. Leia mais nos Termos de Uso.
LUIS
Aviso legal
As informações e publicações não se destinam a ser, e não constituem, conselhos ou recomendações financeiras, de investimento, comerciais ou de outro tipo fornecidos ou endossados pela TradingView. Leia mais nos Termos de Uso.