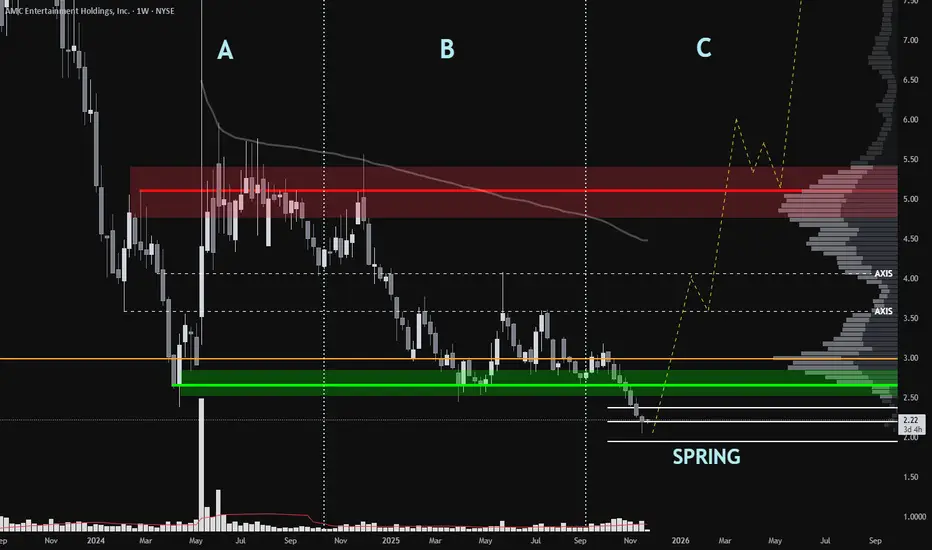
I believe  AMC has been in a large accumulation starting around April 24'. The most recent break below the range on decreasing volume leads me to believe we are in Phase C. In order for this to be a Spring, we need to see strong volume come into the upside to break back into the range and a test of Supply. A break above Supply would be a Sign of Strength. (SOS) While many scream fundamentals, I choose to trade the chart. With that said, a strong Q4 could flip net profit positive. (HUGE) I see deep value in AMC if they can pull off profitability in Q4. This is just my opinion and what I see on the chart. I am focused on the Wyckoff events and phases. As far as timing, I wish I could remove the dates below the chart. This is my thesis.
Originally posted on Nov. 19th. Had to remove due to educational link to external source explaining what accumulations and distributions are.
AMC has been in a large accumulation starting around April 24'. The most recent break below the range on decreasing volume leads me to believe we are in Phase C. In order for this to be a Spring, we need to see strong volume come into the upside to break back into the range and a test of Supply. A break above Supply would be a Sign of Strength. (SOS) While many scream fundamentals, I choose to trade the chart. With that said, a strong Q4 could flip net profit positive. (HUGE) I see deep value in AMC if they can pull off profitability in Q4. This is just my opinion and what I see on the chart. I am focused on the Wyckoff events and phases. As far as timing, I wish I could remove the dates below the chart. This is my thesis. Originally posted on Nov. 19th. Had to remove due to educational link to external source explaining what accumulations and distributions are.
Trade ativo
Nice monthly close! 🔨Nota
Patiently waiting for AMC to make its way back in to the trading range. (roughly above the $2.60 region) This is a macro accumulation and will take time.A Deep Crab Harmonic pattern has printed on the Daily. Levels to watch are as follows:
T2: $3.14
T1: $2.57
BC: $1.91
XA: $1.80
HOP: $1.19
Nota
Looks like a high volume break of the downtrend on the Daily. Q1 outperformed. Is the bottom in? Now lets go test the range.
Aviso legal
As informações e publicações não se destinam a ser, e não constituem, conselhos ou recomendações financeiras, de investimento, comerciais ou de outro tipo fornecidos ou endossados pela TradingView. Leia mais nos Termos de Uso.
Aviso legal
As informações e publicações não se destinam a ser, e não constituem, conselhos ou recomendações financeiras, de investimento, comerciais ou de outro tipo fornecidos ou endossados pela TradingView. Leia mais nos Termos de Uso.