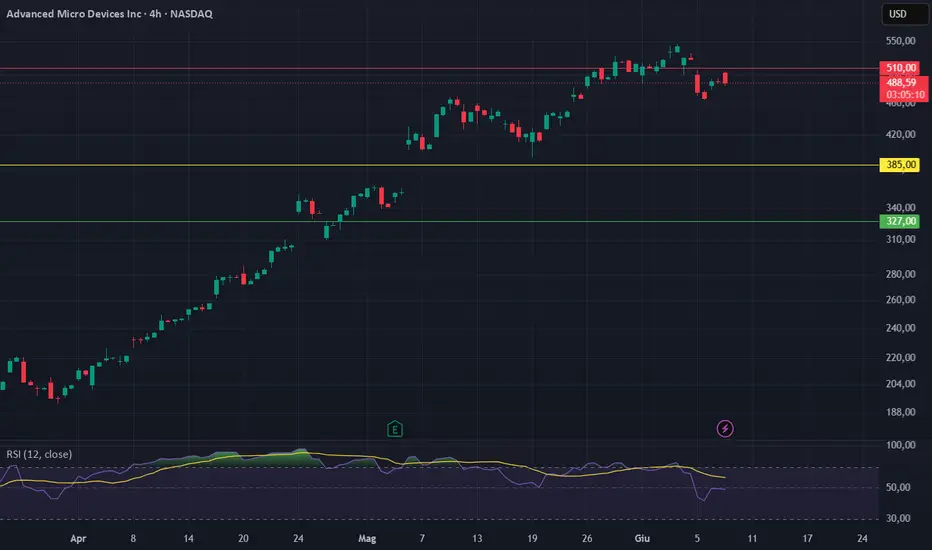
Quick fundamental update on  AMD based on current June 2026 data.
While the charts show strong momentum after the recent $542 peak, a cold look at the Free Cash Flow to the Firm (FCFF) model suggests the stock is heavily extended into overvalued territory.
Here is the breakdown of the Narrative & Numbers backing this view.
1. The Model Inputs (10-Year Framework)
Top-line Growth: Assumed a 35% CAGR for the next 5 years, tracking aggressive AI Data Center expansion and sustained market share gains against Intel.
Target Operating Margin: 26.0% (assuming scaling efficiencies from high-margin AI chips).
Sales-to-Capital: 1.85 (reflecting asset-light, fabless efficiency).
WACC: 9.65% based on a bottom-up sector beta of 1.25 (levered to 1.28).
2. Intrinsic Value Output
Discounting the cash flows and adding net cash yields an intrinsic value of $385.00 per share.
At the current price of ~$489, the market is pricing in an implied revenue growth north of 40% with margins above 30%. There is zero margin for error left at these multiples (P/E currently sitting well over 160x).
3. Key Trading Levels to Watch
Take Profit / Short Zone ($510 - $540): A retest of the old highs represents a heavy fundamental wall. Good area to trim longs or look for exhaustion candles to short.
Fair Value Target ($385): The baseline where the fundamentals match the price.
Buy Trigger ($327 and below): This represents a 15% Margin of Safety below fair value. I'm sitting on my hands until we get a macro flush to this zone.
Bottom line: The AI narrative is strong, but the cash flows don't justify chasing the stock here. Risk/Reward is heavily skewed to the downside for mid-term holders.
What's your play here? Holding the trend or looking for a pullback? Let me know in the comments.
AMD based on current June 2026 data.While the charts show strong momentum after the recent $542 peak, a cold look at the Free Cash Flow to the Firm (FCFF) model suggests the stock is heavily extended into overvalued territory.
Here is the breakdown of the Narrative & Numbers backing this view.
1. The Model Inputs (10-Year Framework)
Top-line Growth: Assumed a 35% CAGR for the next 5 years, tracking aggressive AI Data Center expansion and sustained market share gains against Intel.
Target Operating Margin: 26.0% (assuming scaling efficiencies from high-margin AI chips).
Sales-to-Capital: 1.85 (reflecting asset-light, fabless efficiency).
WACC: 9.65% based on a bottom-up sector beta of 1.25 (levered to 1.28).
2. Intrinsic Value Output
Discounting the cash flows and adding net cash yields an intrinsic value of $385.00 per share.
At the current price of ~$489, the market is pricing in an implied revenue growth north of 40% with margins above 30%. There is zero margin for error left at these multiples (P/E currently sitting well over 160x).
3. Key Trading Levels to Watch
Take Profit / Short Zone ($510 - $540): A retest of the old highs represents a heavy fundamental wall. Good area to trim longs or look for exhaustion candles to short.
Fair Value Target ($385): The baseline where the fundamentals match the price.
Buy Trigger ($327 and below): This represents a 15% Margin of Safety below fair value. I'm sitting on my hands until we get a macro flush to this zone.
Bottom line: The AI narrative is strong, but the cash flows don't justify chasing the stock here. Risk/Reward is heavily skewed to the downside for mid-term holders.
What's your play here? Holding the trend or looking for a pullback? Let me know in the comments.

Aviso legal
As informações e publicações não se destinam a ser, e não constituem, conselhos ou recomendações financeiras, de investimento, comerciais ou de outro tipo fornecidos ou endossados pela TradingView. Leia mais nos Termos de Uso.
Aviso legal
As informações e publicações não se destinam a ser, e não constituem, conselhos ou recomendações financeiras, de investimento, comerciais ou de outro tipo fornecidos ou endossados pela TradingView. Leia mais nos Termos de Uso.