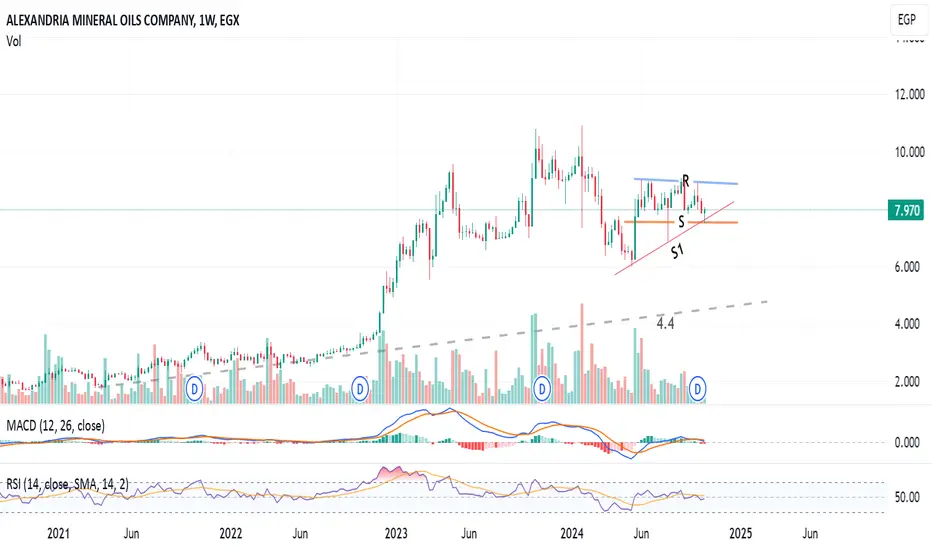
Daily chart
The stock AMOC is trading in a channel between lines R and S, so the opportunity to buy near support S and sell near resistance line R (at around 8.9)
Technical indicators RSI and MACD are supporting the bullish view.
Closing above 9.0 for 3 days, the target will be 10.5
Closing above 10.9 for 2 weeks, the target will be 12
Below line S is considered a stop loss level, as the next down target will be 6.0
Note: Always keep a profit protection level, and raise it as the price goes up.
The stock
AMOC is trading in a channel between lines R and S, so the opportunity to buy near support S and sell near resistance line R (at around 8.9)Technical indicators RSI and MACD are supporting the bullish view.
Closing above 9.0 for 3 days, the target will be 10.5
Closing above 10.9 for 2 weeks, the target will be 12
Below line S is considered a stop loss level, as the next down target will be 6.0
Note: Always keep a profit protection level, and raise it as the price goes up.

Aviso legal
As informações e publicações não se destinam a ser, e não constituem, conselhos ou recomendações financeiras, de investimento, comerciais ou de outro tipo fornecidos ou endossados pela TradingView. Leia mais nos Termos de Uso.
Aviso legal
As informações e publicações não se destinam a ser, e não constituem, conselhos ou recomendações financeiras, de investimento, comerciais ou de outro tipo fornecidos ou endossados pela TradingView. Leia mais nos Termos de Uso.