
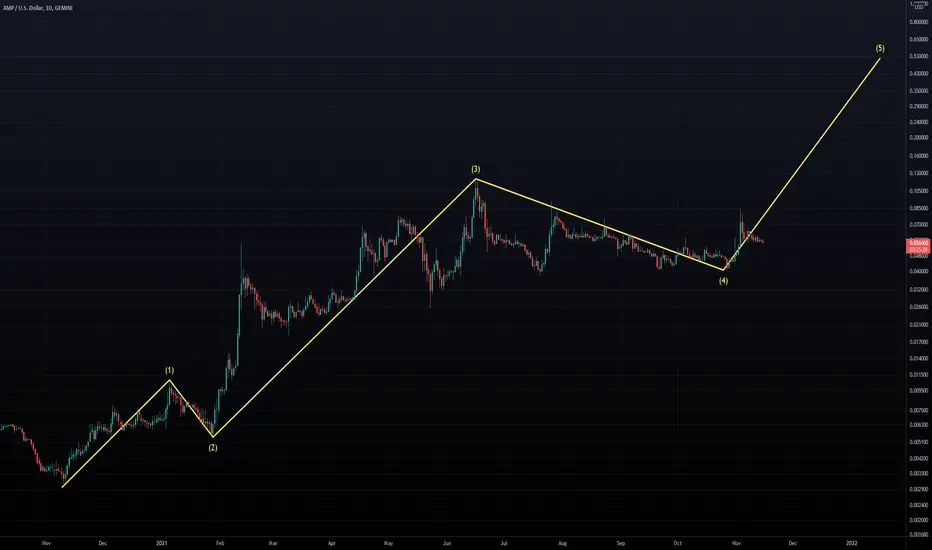
So going off of my first published idea of the Flat 3-3-5 ABC Correction from June 16 to Oct 27, I've read that flats are typically found in the 4th wave position of the Elliott Impulse Wave pattern. If that's the case, then we should be looking at wave 5 next for AMP, which lines up with the EOY to Q1 2022 Altseason that's coming.
What I've been trying to figure out is where Waves 1, 2, and 3 should be plotted. I think the Coinbase listing effect in June disrupted the waves structure a bit because Wave 3 should've been in May when AMP hit an ATH of $0.0785. But where I've plotted Wave 3 now lines up with the ABC correction from June to October. I also tried plotting Wave 1 to the peak on Feb 12 and Wave 2 to the low on Mar 9, but that would break the rule where Wave 4 is not supposed to be lower than Wave 1.
Would like to hear your thoughts!
What I've been trying to figure out is where Waves 1, 2, and 3 should be plotted. I think the Coinbase listing effect in June disrupted the waves structure a bit because Wave 3 should've been in May when AMP hit an ATH of $0.0785. But where I've plotted Wave 3 now lines up with the ABC correction from June to October. I also tried plotting Wave 1 to the peak on Feb 12 and Wave 2 to the low on Mar 9, but that would break the rule where Wave 4 is not supposed to be lower than Wave 1.
Would like to hear your thoughts!

Publicações relacionadas
Aviso legal
As informações e publicações não se destinam a ser, e não constituem, conselhos ou recomendações financeiras, de investimento, comerciais ou de outro tipo fornecidos ou endossados pela TradingView. Leia mais nos Termos de Uso.
Publicações relacionadas
Aviso legal
As informações e publicações não se destinam a ser, e não constituem, conselhos ou recomendações financeiras, de investimento, comerciais ou de outro tipo fornecidos ou endossados pela TradingView. Leia mais nos Termos de Uso.