
Hello Traders,
welcome to this free and educational multi-timeframe technical analysis .
On the weekly timeframe you can see that Amazon stock is currently breaking above a major previous weekly structure area exactly at the $105 level which is now turned support.
You can also see that over the past months, Amazon has been creating a solid double bottom, weekly market structure and moving averages are also very bullish, so I am now just waiting for a retracement and then I do expect more continuation towards the upside.
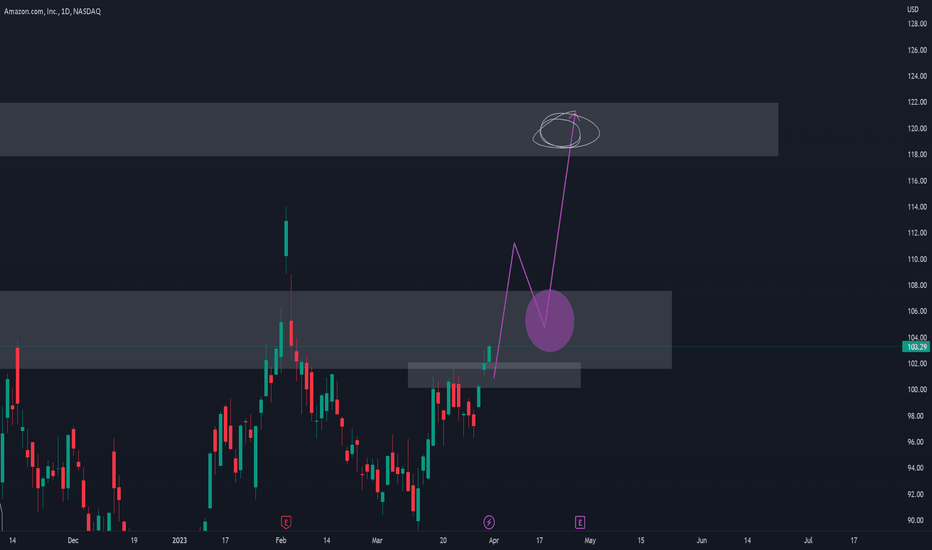
On the daily timeframe you can see that with today's candle, Amazon stock is perfectly breaking above a major previous daily resistance area at the $112 level which is now turned support so I am now just waiting for a retest and then I am looking to get long on Amazon.
Thank you for watching and I will see you tomorrow!
You can also check out my previous analysis of this asset:
welcome to this free and educational multi-timeframe technical analysis .
On the weekly timeframe you can see that Amazon stock is currently breaking above a major previous weekly structure area exactly at the $105 level which is now turned support.
You can also see that over the past months, Amazon has been creating a solid double bottom, weekly market structure and moving averages are also very bullish, so I am now just waiting for a retracement and then I do expect more continuation towards the upside.
On the daily timeframe you can see that with today's candle, Amazon stock is perfectly breaking above a major previous daily resistance area at the $112 level which is now turned support so I am now just waiting for a retest and then I am looking to get long on Amazon.
Thank you for watching and I will see you tomorrow!
You can also check out my previous analysis of this asset:

#1 Video Author on @TradingView 🏆
Swing Trader since the Year 2019 💻
Daily Analysis from Monday - Friday 💰
4K+ Traders in Our FREE Community👇
discord.gg/jgdrYXwqyD
Swing Trader since the Year 2019 💻
Daily Analysis from Monday - Friday 💰
4K+ Traders in Our FREE Community👇
discord.gg/jgdrYXwqyD
Aviso legal
As informações e publicações não se destinam a ser, e não constituem, conselhos ou recomendações financeiras, de investimento, comerciais ou de outro tipo fornecidos ou endossados pela TradingView. Leia mais nos Termos de Uso.