
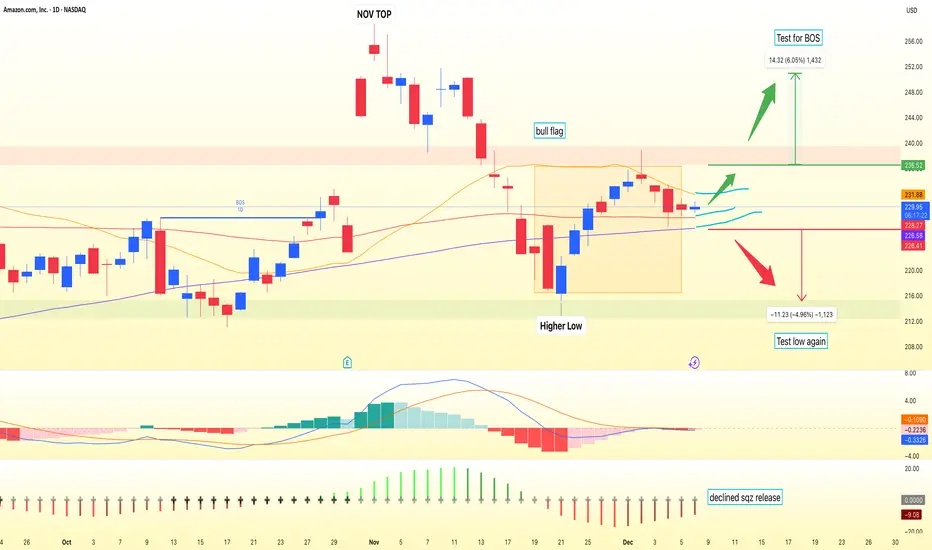
Amazon (AMZN) is trending higher on the daily chart after a strong rally off the mid-October low, confirmed by a bullish Break of Structure and price holding above the rising 60-day and 120-day moving averages. Price is now consolidating in a classic bull flag beneath resistance, with key demand anchored near the $215.00 base of the prior reversal and a major support zone building around $218–224.
The primary path is continuation. A decisive daily close above $236 would confirm a breakout from the flag and clear the $235.50 resistance ceiling, opening room toward the $240 area and then the $248–250 zone as trend-followers step back in. A more conservative trend approach looks for a dip toward the 60-day moving average near $228 and a subsequent reclaim of $229, signaling buyers defending dynamic support and aiming for a retest of the recent highs.
If price instead closes below $226, that would warn of pattern failure and invite a deeper correction toward the $218 major support and potentially lower. Below that, the bullish thesis weakens materially and any long bias should be reassessed until structure improves. This is a study, not financial advice. Manage risk and invalidations.
Thought of the Day 💡
Strong trends rarely move in straight lines—most of the edge is found in how you trade the pauses.
------------------------
Thanks for your support!
If you found this idea helpful or learned something new, drop a like 👍 and leave a comment, I’d love to hear your thoughts!
The primary path is continuation. A decisive daily close above $236 would confirm a breakout from the flag and clear the $235.50 resistance ceiling, opening room toward the $240 area and then the $248–250 zone as trend-followers step back in. A more conservative trend approach looks for a dip toward the 60-day moving average near $228 and a subsequent reclaim of $229, signaling buyers defending dynamic support and aiming for a retest of the recent highs.
If price instead closes below $226, that would warn of pattern failure and invite a deeper correction toward the $218 major support and potentially lower. Below that, the bullish thesis weakens materially and any long bias should be reassessed until structure improves. This is a study, not financial advice. Manage risk and invalidations.
Thought of the Day 💡
Strong trends rarely move in straight lines—most of the edge is found in how you trade the pauses.
------------------------
Thanks for your support!
If you found this idea helpful or learned something new, drop a like 👍 and leave a comment, I’d love to hear your thoughts!

follow my X 👉 x.com/bbqgio
🔥 level up your Stock, FX, & Crypto: VIP access to AI technical analysis and pro market insights at TradeOS + 50%-off promo code ONBOARD 👉
ai.tradeos.xyz/?utm_source=tvbg
🔥 level up your Stock, FX, & Crypto: VIP access to AI technical analysis and pro market insights at TradeOS + 50%-off promo code ONBOARD 👉
ai.tradeos.xyz/?utm_source=tvbg
Publicações relacionadas
Aviso legal
As informações e publicações não se destinam a ser, e não constituem, conselhos ou recomendações financeiras, de investimento, comerciais ou de outro tipo fornecidos ou endossados pela TradingView. Leia mais nos Termos de Uso.
follow my X 👉 x.com/bbqgio
🔥 level up your Stock, FX, & Crypto: VIP access to AI technical analysis and pro market insights at TradeOS + 50%-off promo code ONBOARD 👉
ai.tradeos.xyz/?utm_source=tvbg
🔥 level up your Stock, FX, & Crypto: VIP access to AI technical analysis and pro market insights at TradeOS + 50%-off promo code ONBOARD 👉
ai.tradeos.xyz/?utm_source=tvbg
Publicações relacionadas
Aviso legal
As informações e publicações não se destinam a ser, e não constituem, conselhos ou recomendações financeiras, de investimento, comerciais ou de outro tipo fornecidos ou endossados pela TradingView. Leia mais nos Termos de Uso.