
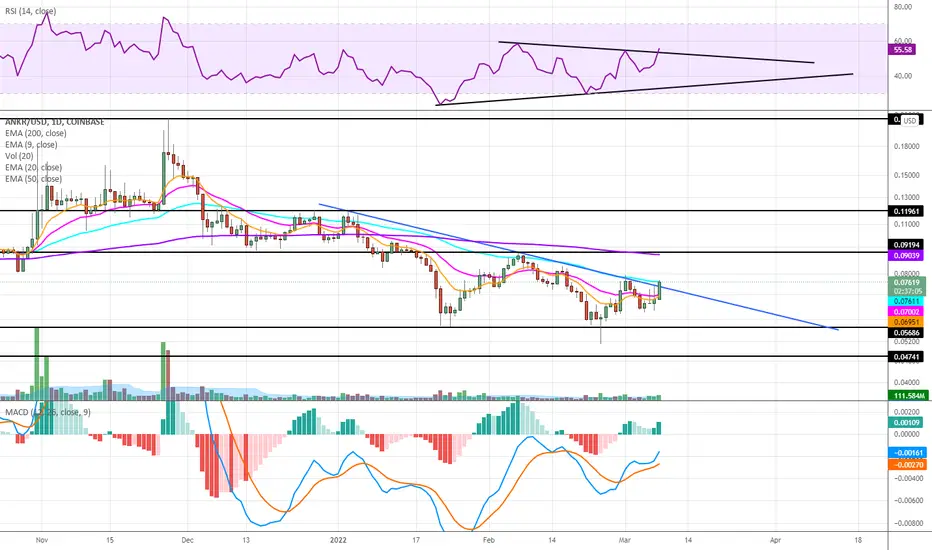
Been following this one for a week or so now. Starting to show signs of strength compared to a choppy sideways market.
Clear hidden bullish divergence on the daily chart with RSI rising as the price declines. Volume has been increasing the past few days as it's starting to break the blue downtrend line.
If the market doesn't shit the bed we could see this pop to the 200EMA around 0.09 where there's also resistance around 0.092. Will need a good amount of volume to break that.
Clear hidden bullish divergence on the daily chart with RSI rising as the price declines. Volume has been increasing the past few days as it's starting to break the blue downtrend line.
If the market doesn't shit the bed we could see this pop to the 200EMA around 0.09 where there's also resistance around 0.092. Will need a good amount of volume to break that.

Aviso legal
As informações e publicações não se destinam a ser, e não constituem, conselhos ou recomendações financeiras, de investimento, comerciais ou de outro tipo fornecidos ou endossados pela TradingView. Leia mais nos Termos de Uso.
Aviso legal
As informações e publicações não se destinam a ser, e não constituem, conselhos ou recomendações financeiras, de investimento, comerciais ou de outro tipo fornecidos ou endossados pela TradingView. Leia mais nos Termos de Uso.