Atualizado
APHA Rising Wedge on Hourly Uptrend
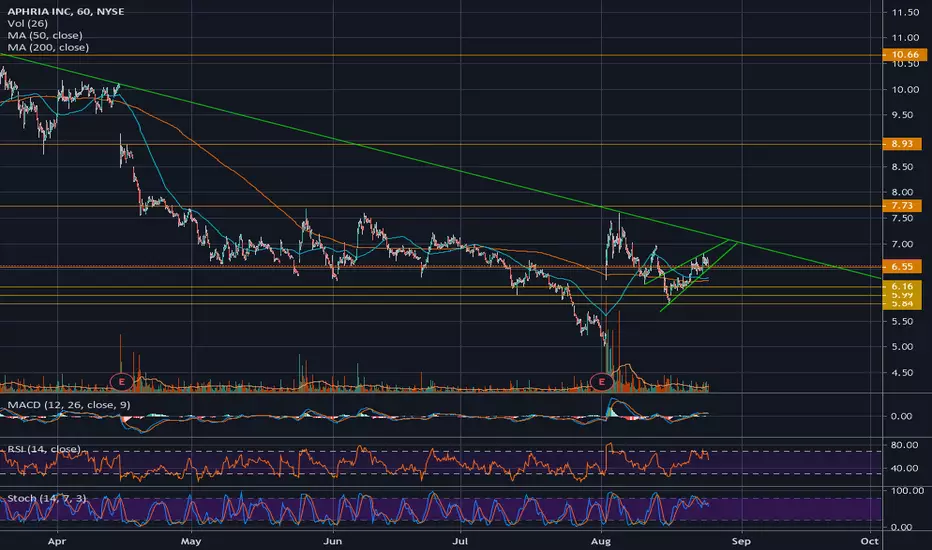
Rising wedge pattern on the hourly chart. Daily indicators show possible underlying strength, but hourly volume is decreasing. Broader markets could see a bounce on Monday, and APHA is likely to participate, but chances are very small that it'll break this pattern bullish.
Trade with caution.
Trade with caution.
Nota
As expected, a bearish confirmation of this rising wedge pattern. Now we are looking at a descending triangle on the daily charts, another bearish pattern, indicating that APHA may want to close the bull gap before reaching for new highs. It makes sense, to expect buyers to wait there, patiently. Seems like a great level to get in for a long position - $5.20ish.Nota
Correction - $5.40ish
🅱🄰🆁🅺🆆🄾🆁🆃🅷
theBarkworthyNotes.com
theBarkworthyNotes.com
Aviso legal
As informações e publicações não se destinam a ser, e não constituem, conselhos ou recomendações financeiras, de investimento, comerciais ou de outro tipo fornecidos ou endossados pela TradingView. Leia mais nos Termos de Uso.
🅱🄰🆁🅺🆆🄾🆁🆃🅷
theBarkworthyNotes.com
theBarkworthyNotes.com
Aviso legal
As informações e publicações não se destinam a ser, e não constituem, conselhos ou recomendações financeiras, de investimento, comerciais ou de outro tipo fornecidos ou endossados pela TradingView. Leia mais nos Termos de Uso.