
On the weekly chart, ARIA has two unfilled Fair Value Gaps (FVGs) sitting around the 0.10 area and below, aligning with the 0.618 Fib retracement — a key potential draw-on-liquidity zone if price revisits deeper levels later in the cycle.
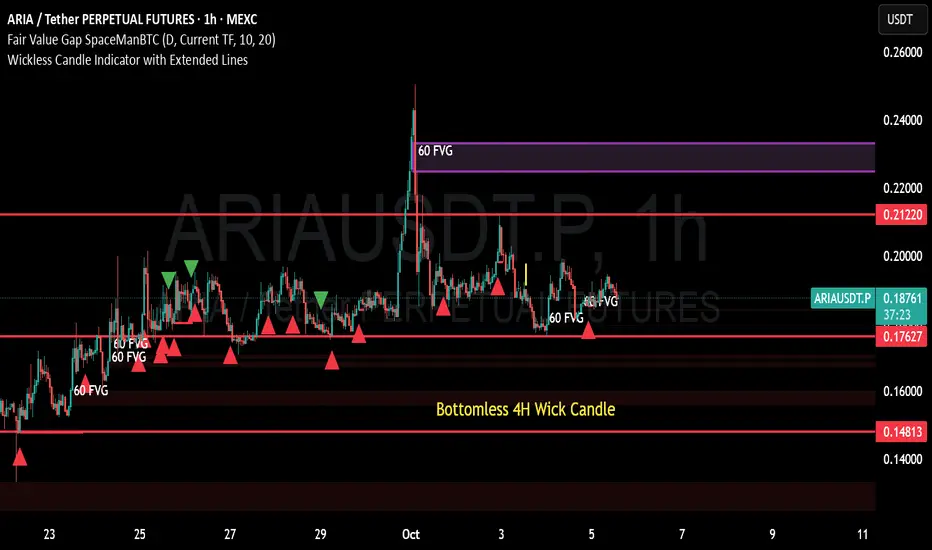
On the 4-hour timeframe, structure remains reactive, with a clean FVG above price between 0.224–0.234, acting as an immediate upside magnet.
The 1-hour and 30-minute charts confirm this same gap, showing confluence that price may want to tap into before deciding direction.
Short-term charts (15m, 5m, and 1m) reveal a sequence of smaller FVGs leading up to a final one at 0.2402–0.2444, suggesting a possible liquidity sweep before any retracement.
Watching for signs of exhaustion near that zone could give a high-probability short setup or partial take-profit area for longs.
📊 Key zones:
1H/4H FVG above: 0.224–0.234
Short-term FVG clusters: 0.240–0.244
Weekly FVGs below: ~0.10 area (longer-term retrace zone)
On the 4-hour timeframe, structure remains reactive, with a clean FVG above price between 0.224–0.234, acting as an immediate upside magnet.
The 1-hour and 30-minute charts confirm this same gap, showing confluence that price may want to tap into before deciding direction.
Short-term charts (15m, 5m, and 1m) reveal a sequence of smaller FVGs leading up to a final one at 0.2402–0.2444, suggesting a possible liquidity sweep before any retracement.
Watching for signs of exhaustion near that zone could give a high-probability short setup or partial take-profit area for longs.
📊 Key zones:
1H/4H FVG above: 0.224–0.234
Short-term FVG clusters: 0.240–0.244
Weekly FVGs below: ~0.10 area (longer-term retrace zone)

Aviso legal
As informações e publicações não se destinam a ser, e não constituem, conselhos ou recomendações financeiras, de investimento, comerciais ou de outro tipo fornecidos ou endossados pela TradingView. Leia mais nos Termos de Uso.
Aviso legal
As informações e publicações não se destinam a ser, e não constituem, conselhos ou recomendações financeiras, de investimento, comerciais ou de outro tipo fornecidos ou endossados pela TradingView. Leia mais nos Termos de Uso.