

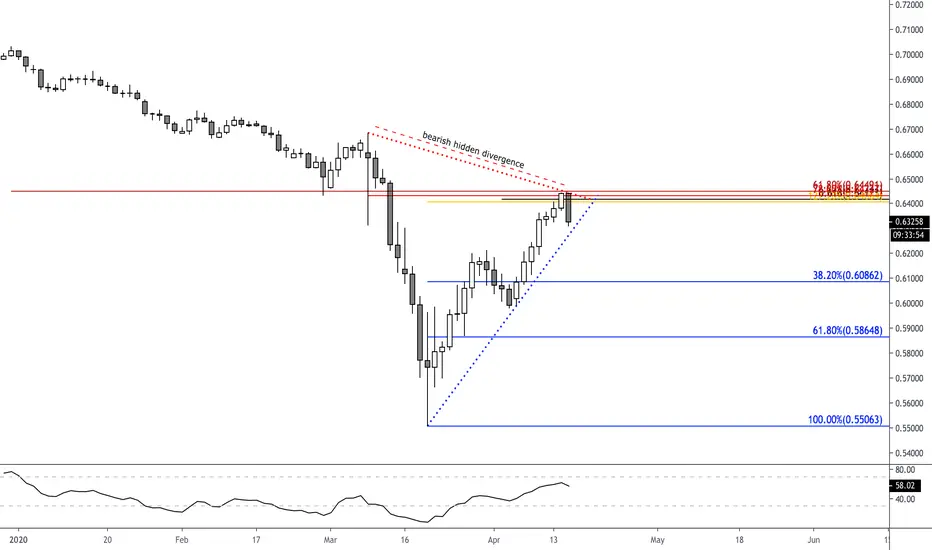
A fibonacci cluster indicates potential reversal zones, on any chart, in any market. They are used to anticipate major support/resistance levels.
In this chart the cluster is made up by 4 different levels, consisting of:
61.8% retracement (dark red)
78.6% retracement (red)
127.2% extension (golden)
0.618 projection (black)
Bearish hidden divergence, in which price forms a lower high while the oscillator is showing higher highs, confirms the short bias.
The blue levels show potential support levels.
Looks like $ is gaining strength ??
Good luck to all trading AUDUSD
In this chart the cluster is made up by 4 different levels, consisting of:
61.8% retracement (dark red)
78.6% retracement (red)
127.2% extension (golden)
0.618 projection (black)
Bearish hidden divergence, in which price forms a lower high while the oscillator is showing higher highs, confirms the short bias.
The blue levels show potential support levels.
Looks like $ is gaining strength ??
Good luck to all trading AUDUSD
Nota
Here is how the 4H timeframe looks like:Nota
This chart is very similar to NZDUSD
Aviso legal
As informações e publicações não se destinam a ser, e não constituem, conselhos ou recomendações financeiras, de investimento, comerciais ou de outro tipo fornecidos ou endossados pela TradingView. Leia mais nos Termos de Uso.
Aviso legal
As informações e publicações não se destinam a ser, e não constituem, conselhos ou recomendações financeiras, de investimento, comerciais ou de outro tipo fornecidos ou endossados pela TradingView. Leia mais nos Termos de Uso.