

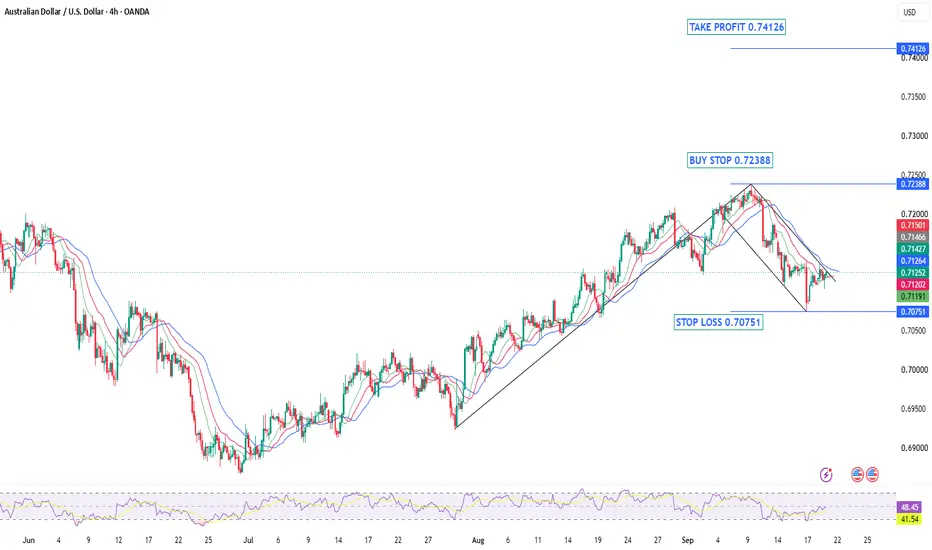
After months of bearish pressure that dominated the first half of the year, AUDUSD has made a remarkable recovery. Since mid-July, the pair has been carving out a textbook bullish structure — printing a clean series of Higher Highs and Higher Lows — a classic sign that buyers are firmly in control and the market is in a healthy Advancing Phase.
The rally was strong and impulsive, with price gaining significant ground in a relatively short period of time. This kind of momentum tells us that there is genuine buying interest behind this move — not just a temporary bounce.
The Flag Formation
After such a strong impulse move pushing price all the way up to the 0.7238 resistance zone, it was only natural for the market to pause and consolidate. This is exactly what happened. Price pulled back in an orderly and controlled manner — not a sharp reversal, not panic selling — just a healthy cooldown. This consolidation formed a Bullish Flag pattern, which is one of the most reliable continuation patterns in technical analysis.
The flag has been respecting its boundaries cleanly. Price is compressing, momentum is being reset, and the market appears to be coiling up for the next move. This is exactly the kind of price action that precedes a strong breakout.
What We Are Looking For
A clean breakout and close above the upper boundary of the flag at 0.72388 would confirm that the consolidation phase is over and the trend is ready to resume. Once buyers take control above that level, the path toward 0.74126 opens up — a significant supply zone and our target for this setup.
The stop loss is placed at 0.70751, below the flag structure and recent swing low — giving the trade enough room to breathe while keeping risk defined.
Levels to Watch:
🔵 Buy Stop: 0.72388 (breakout confirmation)
🔴 Stop Loss: 0.70751 (below flag & swing low)
🟢 Take Profit: 0.74126 (supply zone)
As always, patience is key. We do not chase — we wait for the market to come to our level and confirm before entering.
Not financial advice. Trade your own plan.
The rally was strong and impulsive, with price gaining significant ground in a relatively short period of time. This kind of momentum tells us that there is genuine buying interest behind this move — not just a temporary bounce.
The Flag Formation
After such a strong impulse move pushing price all the way up to the 0.7238 resistance zone, it was only natural for the market to pause and consolidate. This is exactly what happened. Price pulled back in an orderly and controlled manner — not a sharp reversal, not panic selling — just a healthy cooldown. This consolidation formed a Bullish Flag pattern, which is one of the most reliable continuation patterns in technical analysis.
The flag has been respecting its boundaries cleanly. Price is compressing, momentum is being reset, and the market appears to be coiling up for the next move. This is exactly the kind of price action that precedes a strong breakout.
What We Are Looking For
A clean breakout and close above the upper boundary of the flag at 0.72388 would confirm that the consolidation phase is over and the trend is ready to resume. Once buyers take control above that level, the path toward 0.74126 opens up — a significant supply zone and our target for this setup.
The stop loss is placed at 0.70751, below the flag structure and recent swing low — giving the trade enough room to breathe while keeping risk defined.
Levels to Watch:
🔵 Buy Stop: 0.72388 (breakout confirmation)
🔴 Stop Loss: 0.70751 (below flag & swing low)
🟢 Take Profit: 0.74126 (supply zone)
As always, patience is key. We do not chase — we wait for the market to come to our level and confirm before entering.
Not financial advice. Trade your own plan.

Aviso legal
As informações e publicações não se destinam a ser, e não constituem, conselhos ou recomendações financeiras, de investimento, comerciais ou de outro tipo fornecidos ou endossados pela TradingView. Leia mais nos Termos de Uso.
Aviso legal
As informações e publicações não se destinam a ser, e não constituem, conselhos ou recomendações financeiras, de investimento, comerciais ou de outro tipo fornecidos ou endossados pela TradingView. Leia mais nos Termos de Uso.