
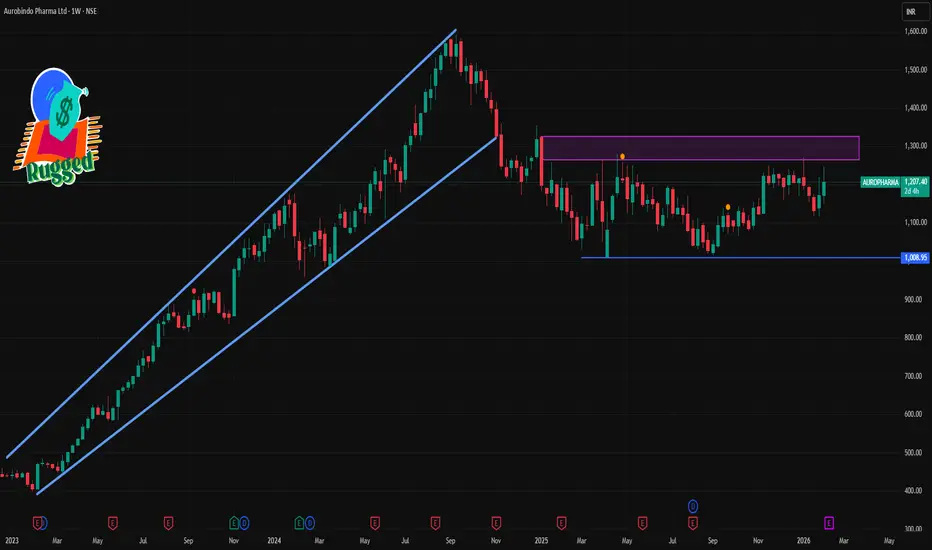
📊 Weekly Support & Resistance (Key Levels)
Weekly Pivot (approx): ~₹1,180–1,190 area (reference level for weekly bias)
Resistance Levels:
R1: ~₹1,215–1,220 – first major upside hurdle (weekly)
R2: ~₹1,250–1,260 – possible next resistance above R1
R3: ~₹1,275–1,280+ – strong weekly supply zone if bullish momentum continues
Support Levels:
S1: ~₹1,155–1,160 – initial weekly support zone
S2: ~₹1,130–1,140 – deeper support if weekly price corrects further
S3: ~₹1,100 – structural support and breakdown zone for bears
📉 Weekly Momentum & Trend Signals
Weekly indicators (RSI, MACD, SMA) suggest mixed to slightly bullish bias, with price trading around medium‑term moving averages — not extremely overbought or oversold.
Earlier weekly data also showed strong weekly moving average support near ~₹1,100–1,140 range.
🧠 How to Use These Levels
Bullish Scenario: A clean weekly close above ~₹1,215–1,220 can open room toward ₹1,250–1,280+.
Bearish Scenario: Weekly rejection and close below ~₹1,155–1,160 may see support tests around ₹1,130 and ₹1,100.
Use these in combination with weekly candlestick patterns (like closes beyond support/resistance) to confirm breakouts or breakdowns.
⚠️ Note: Technical levels change with price action. These are indicative ranges based on recent weekly pivot computations and should be complemented with your own charting or broker platform data for precise decision making.
Weekly Pivot (approx): ~₹1,180–1,190 area (reference level for weekly bias)
Resistance Levels:
R1: ~₹1,215–1,220 – first major upside hurdle (weekly)
R2: ~₹1,250–1,260 – possible next resistance above R1
R3: ~₹1,275–1,280+ – strong weekly supply zone if bullish momentum continues
Support Levels:
S1: ~₹1,155–1,160 – initial weekly support zone
S2: ~₹1,130–1,140 – deeper support if weekly price corrects further
S3: ~₹1,100 – structural support and breakdown zone for bears
📉 Weekly Momentum & Trend Signals
Weekly indicators (RSI, MACD, SMA) suggest mixed to slightly bullish bias, with price trading around medium‑term moving averages — not extremely overbought or oversold.
Earlier weekly data also showed strong weekly moving average support near ~₹1,100–1,140 range.
🧠 How to Use These Levels
Bullish Scenario: A clean weekly close above ~₹1,215–1,220 can open room toward ₹1,250–1,280+.
Bearish Scenario: Weekly rejection and close below ~₹1,155–1,160 may see support tests around ₹1,130 and ₹1,100.
Use these in combination with weekly candlestick patterns (like closes beyond support/resistance) to confirm breakouts or breakdowns.
⚠️ Note: Technical levels change with price action. These are indicative ranges based on recent weekly pivot computations and should be complemented with your own charting or broker platform data for precise decision making.

Contact Knowledgehub for a detailed consultation: Dm on WhatsApp: [wa.link/a2o0kz]-
Phone No: [+91 93102 26243]-
Email: [tradingviewknowledgehub@gmail.com]---
-- Let’s achieve success together!
Phone No: [+91 93102 26243]-
Email: [tradingviewknowledgehub@gmail.com]---
-- Let’s achieve success together!
Publicações relacionadas
Aviso legal
As informações e publicações não se destinam a ser, e não constituem, conselhos ou recomendações financeiras, de investimento, comerciais ou de outro tipo fornecidos ou endossados pela TradingView. Leia mais nos Termos de Uso.
Contact Knowledgehub for a detailed consultation: Dm on WhatsApp: [wa.link/a2o0kz]-
Phone No: [+91 93102 26243]-
Email: [tradingviewknowledgehub@gmail.com]---
-- Let’s achieve success together!
Phone No: [+91 93102 26243]-
Email: [tradingviewknowledgehub@gmail.com]---
-- Let’s achieve success together!
Publicações relacionadas
Aviso legal
As informações e publicações não se destinam a ser, e não constituem, conselhos ou recomendações financeiras, de investimento, comerciais ou de outro tipo fornecidos ou endossados pela TradingView. Leia mais nos Termos de Uso.