
Hello to all TradingView followers and traders 🌍📈
Hope your trades are always green and profitable 💚🔥
Today we’re taking a look at AUS200 (ASX 200), one of the most important stock market indices in Australia, which can provide a strong overview of overall market sentiment and economic conditions in the Oceania region 🇦🇺📊
This index is heavily influenced by the Reserve Bank of Australia’s policies, commodity prices, and global economic conditions 🌏⚡
That’s why AUS200 often creates attractive opportunities for short-term traders and swing traders 👀📈
AUS200 Technical Analysis 📊🔥
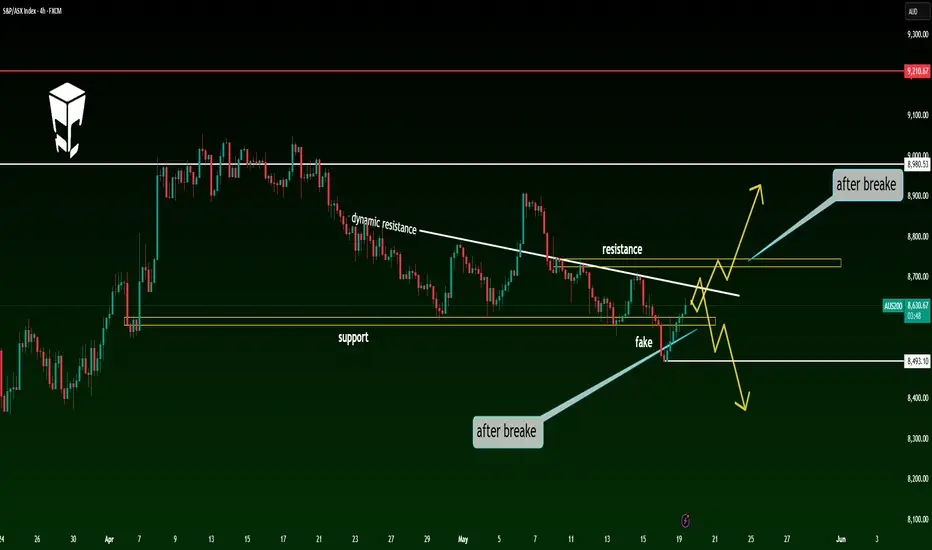
On the 4-hour timeframe, price is currently moving inside a range box structure and has now reached a key support floor ⚠️📉
One important detail is that the market previously created a fake breakout below the support zone and quickly moved back inside the range, which could indicate liquidity collection 🧠💥
At the moment, price is trying to recover, but several important resistance levels are still standing in the way 🚨
Key Chart Observations 📌
🔹 Price is currently sitting on a major 4H support zone 🟡
🔹 The range low was previously broken with a fake breakout ⚠️
🔹 The descending dynamic trendline is still acting as resistance 🔻
🔹 The marked static resistance zone is also a very important level for continuation 📈
Bullish Scenario 🚀📈
📍 If price manages to break above both the descending dynamic resistance and the marked static resistance zone, followed by confirmation and consolidation, we could see the beginning of a new bullish wave 🔥⚡
🎯 Potential upside targets:
And potentially higher levels if bullish momentum increases 📊🚀
Bearish Scenario 📉⚠️
However, if the support floor breaks again and price confirms below this zone, it could become confirmation for continued selling pressure and potential short positions 🐻🔥
📌 In that case, we will wait for bearish structure confirmation before entering the trade in order to reduce risk 🧠✅
Trading Strategy 💡
✅ Long positions after confirmed breakout above resistance levels
✅ Short positions only after a valid support breakdown
⚠️ Waiting for structure confirmation can significantly reduce risk
📌 Never ignore proper risk management
Poll 📊🤔
What’s your opinion on AUS200? 👀
🔘 Resistance will break and a bullish wave will begin 🚀
🔘 Support will fail and the market will continue lower 📉
🔘 The market will remain range-bound 🔄
Make sure to share your thoughts in the comments 💬👇
⚠️ Disclaimer
This analysis reflects personal opinion only and is not financial advice or a buy/sell signal.
Always do your own research and apply proper risk management before entering any trade. 📌
#AUS200 #ASX200 #Indices #TechnicalAnalysis #PriceAction #TradingView #Forex #SupportAndResistance #FakeBreakout #SwingTrade #MarketAnalysis #TradingSetup #Bullish #Bearish #RangeMarket
Hope your trades are always green and profitable 💚🔥
Today we’re taking a look at AUS200 (ASX 200), one of the most important stock market indices in Australia, which can provide a strong overview of overall market sentiment and economic conditions in the Oceania region 🇦🇺📊
This index is heavily influenced by the Reserve Bank of Australia’s policies, commodity prices, and global economic conditions 🌏⚡
That’s why AUS200 often creates attractive opportunities for short-term traders and swing traders 👀📈
AUS200 Technical Analysis 📊🔥
On the 4-hour timeframe, price is currently moving inside a range box structure and has now reached a key support floor ⚠️📉
One important detail is that the market previously created a fake breakout below the support zone and quickly moved back inside the range, which could indicate liquidity collection 🧠💥
At the moment, price is trying to recover, but several important resistance levels are still standing in the way 🚨
Key Chart Observations 📌
🔹 Price is currently sitting on a major 4H support zone 🟡
🔹 The range low was previously broken with a fake breakout ⚠️
🔹 The descending dynamic trendline is still acting as resistance 🔻
🔹 The marked static resistance zone is also a very important level for continuation 📈
Bullish Scenario 🚀📈
📍 If price manages to break above both the descending dynamic resistance and the marked static resistance zone, followed by confirmation and consolidation, we could see the beginning of a new bullish wave 🔥⚡
🎯 Potential upside targets:
And potentially higher levels if bullish momentum increases 📊🚀
Bearish Scenario 📉⚠️
However, if the support floor breaks again and price confirms below this zone, it could become confirmation for continued selling pressure and potential short positions 🐻🔥
📌 In that case, we will wait for bearish structure confirmation before entering the trade in order to reduce risk 🧠✅
Trading Strategy 💡
✅ Long positions after confirmed breakout above resistance levels
✅ Short positions only after a valid support breakdown
⚠️ Waiting for structure confirmation can significantly reduce risk
📌 Never ignore proper risk management
Poll 📊🤔
What’s your opinion on AUS200? 👀
🔘 Resistance will break and a bullish wave will begin 🚀
🔘 Support will fail and the market will continue lower 📉
🔘 The market will remain range-bound 🔄
Make sure to share your thoughts in the comments 💬👇
⚠️ Disclaimer
This analysis reflects personal opinion only and is not financial advice or a buy/sell signal.
Always do your own research and apply proper risk management before entering any trade. 📌
#AUS200 #ASX200 #Indices #TechnicalAnalysis #PriceAction #TradingView #Forex #SupportAndResistance #FakeBreakout #SwingTrade #MarketAnalysis #TradingSetup #Bullish #Bearish #RangeMarket

Aviso legal
As informações e publicações não se destinam a ser, e não constituem, conselhos ou recomendações financeiras, de investimento, comerciais ou de outro tipo fornecidos ou endossados pela TradingView. Leia mais nos Termos de Uso.
Aviso legal
As informações e publicações não se destinam a ser, e não constituem, conselhos ou recomendações financeiras, de investimento, comerciais ou de outro tipo fornecidos ou endossados pela TradingView. Leia mais nos Termos de Uso.