
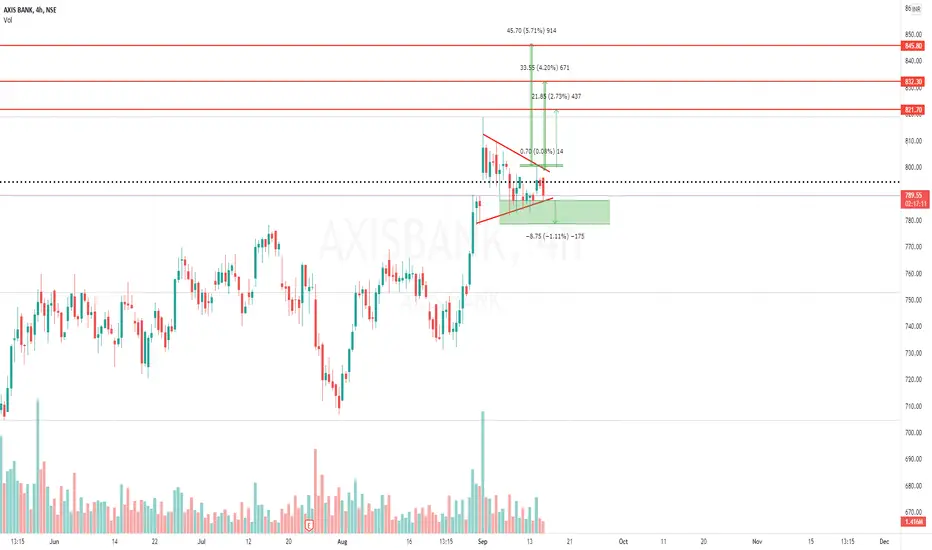
Stock Analysis: AXIS bank has formed the sym triangle pattern, it is good buy around marked demand area with below level as stop loss once it broke the upper level expected to reach the target given on the chart. Let's see.
Happy Investing!
Happy Investing!
Trade ativo
Target 1 done
Aviso legal
As informações e publicações não se destinam a ser, e não constituem, conselhos ou recomendações financeiras, de investimento, comerciais ou de outro tipo fornecidos ou endossados pela TradingView. Leia mais nos Termos de Uso.
Aviso legal
As informações e publicações não se destinam a ser, e não constituem, conselhos ou recomendações financeiras, de investimento, comerciais ou de outro tipo fornecidos ou endossados pela TradingView. Leia mais nos Termos de Uso.