
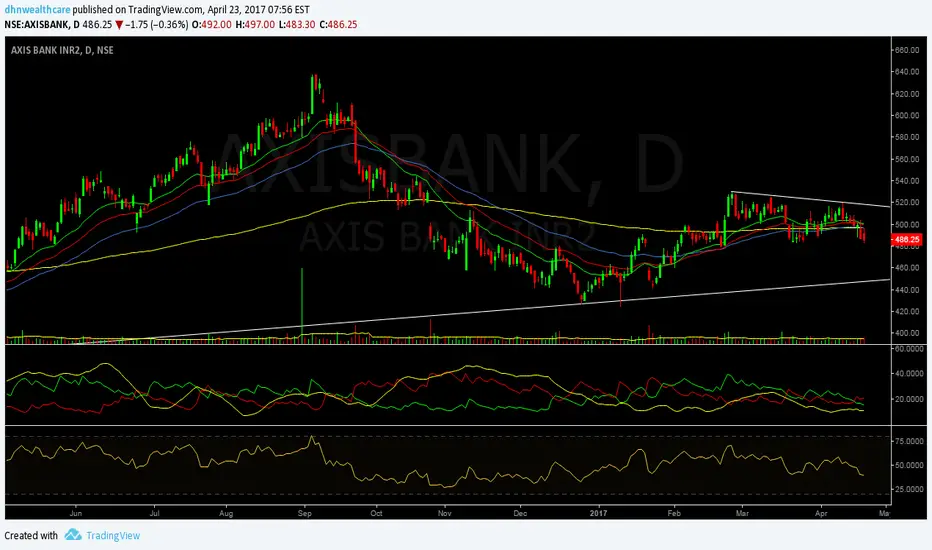
Chart of Axis Bank is suggesting weakness in stock price in coming days. Stock has closed below all short and long term moving averages. Additionally RSI and ADX has given negative divergence on both daily as well as weekly charts.
One can initiate short position on stock between 483-487 levels with stop loss of 521 (last up swing move) for target of 450 in coming 4-6 weeks.
One can initiate short position on stock between 483-487 levels with stop loss of 521 (last up swing move) for target of 450 in coming 4-6 weeks.

Aviso legal
As informações e publicações não se destinam a ser, e não constituem, conselhos ou recomendações financeiras, de investimento, comerciais ou de outro tipo fornecidos ou endossados pela TradingView. Leia mais nos Termos de Uso.
Aviso legal
As informações e publicações não se destinam a ser, e não constituem, conselhos ou recomendações financeiras, de investimento, comerciais ou de outro tipo fornecidos ou endossados pela TradingView. Leia mais nos Termos de Uso.