The stock is currently in a high-risk area for buying.
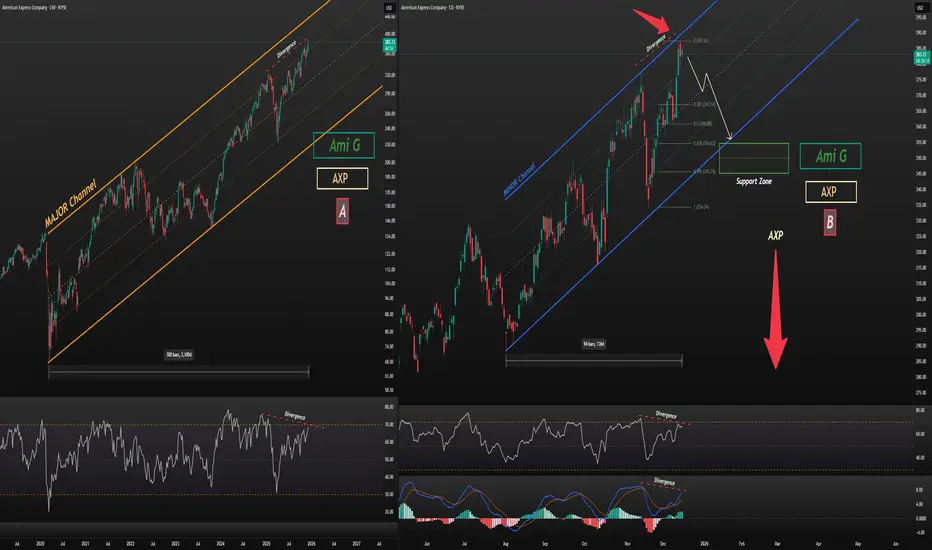
Chart A (Weekly): Price is near the upper boundary of its 5-year channel, accompanied by a clear RSI divergence.
Chart B (Daily): Price is at the top of its 5-month channel, while both MACD and RSI show strong divergences.
Based on these signals, this stock appears to be in a very risky buying zone, with a potential corrective move down to around $355.
This analysis will be updated as the situation develops.
Follow me on TradingView for more analyses and live stock trades.
 AXP
Chart A (Weekly): Price is near the upper boundary of its 5-year channel, accompanied by a clear RSI divergence.
Chart B (Daily): Price is at the top of its 5-month channel, while both MACD and RSI show strong divergences.
Based on these signals, this stock appears to be in a very risky buying zone, with a potential corrective move down to around $355.
This analysis will be updated as the situation develops.
Follow me on TradingView for more analyses and live stock trades.
AXP Trade fechado: objetivo atingido

AG-Precision-Trading
📈 Live Trading: Stocks & Crypto
🔍 Symbol Analysis & Insights
💎 Understanding Relative Asset Values
📈 Live Trading: Stocks & Crypto
🔍 Symbol Analysis & Insights
💎 Understanding Relative Asset Values
Aviso legal
As informações e publicações não se destinam a ser, e não constituem, conselhos ou recomendações financeiras, de investimento, comerciais ou de outro tipo fornecidos ou endossados pela TradingView. Leia mais nos Termos de Uso.
AG-Precision-Trading
📈 Live Trading: Stocks & Crypto
🔍 Symbol Analysis & Insights
💎 Understanding Relative Asset Values
📈 Live Trading: Stocks & Crypto
🔍 Symbol Analysis & Insights
💎 Understanding Relative Asset Values
Aviso legal
As informações e publicações não se destinam a ser, e não constituem, conselhos ou recomendações financeiras, de investimento, comerciais ou de outro tipo fornecidos ou endossados pela TradingView. Leia mais nos Termos de Uso.