
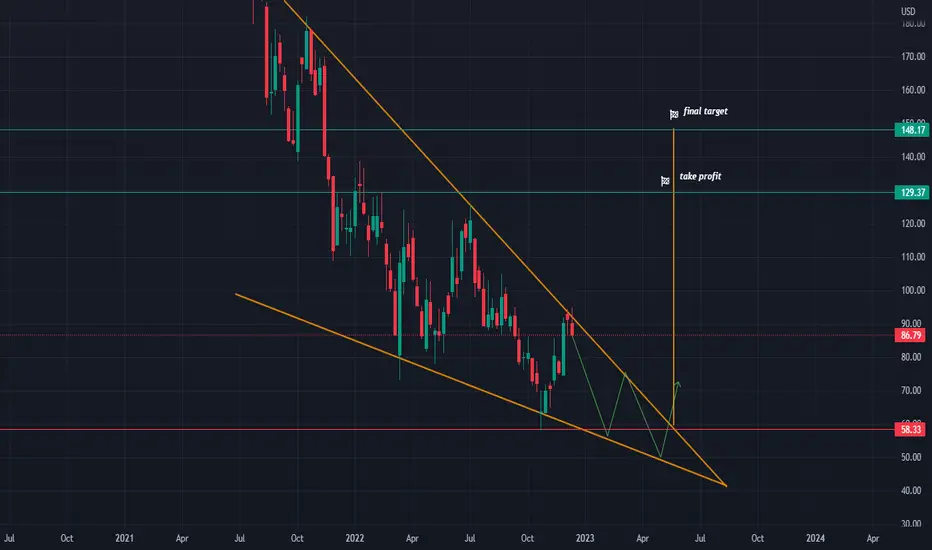
BABA stock has been in a long-term downtrend.
We're expecting the price to continue droping as it looks like it got rejected from the downsloping resistance line on the weekly timeframe.
What we can see on the chart is a pattern called a falling wedge.
Most likely the price will revisit $60 or lower but eventually we expect the breakout in Q2 or Q3 2023.
How to trade:
Enter long position if/when we get a breakout with a volume increase.
Final target and the take profit level are shown on the chart.
Good luck
We're expecting the price to continue droping as it looks like it got rejected from the downsloping resistance line on the weekly timeframe.
What we can see on the chart is a pattern called a falling wedge.
Most likely the price will revisit $60 or lower but eventually we expect the breakout in Q2 or Q3 2023.
How to trade:
Enter long position if/when we get a breakout with a volume increase.
Final target and the take profit level are shown on the chart.
Good luck
Trade ativo
The wedge played out earlier than we expected. The target remains the sameTrade fechado: objetivo atingido
so textbook
💥 Free signals and ideas ➡ t.me/vfinvestment
Publicações relacionadas
Aviso legal
As informações e publicações não se destinam a ser, e não constituem, conselhos ou recomendações financeiras, de investimento, comerciais ou de outro tipo fornecidos ou endossados pela TradingView. Leia mais nos Termos de Uso.
💥 Free signals and ideas ➡ t.me/vfinvestment
Publicações relacionadas
Aviso legal
As informações e publicações não se destinam a ser, e não constituem, conselhos ou recomendações financeiras, de investimento, comerciais ou de outro tipo fornecidos ou endossados pela TradingView. Leia mais nos Termos de Uso.