
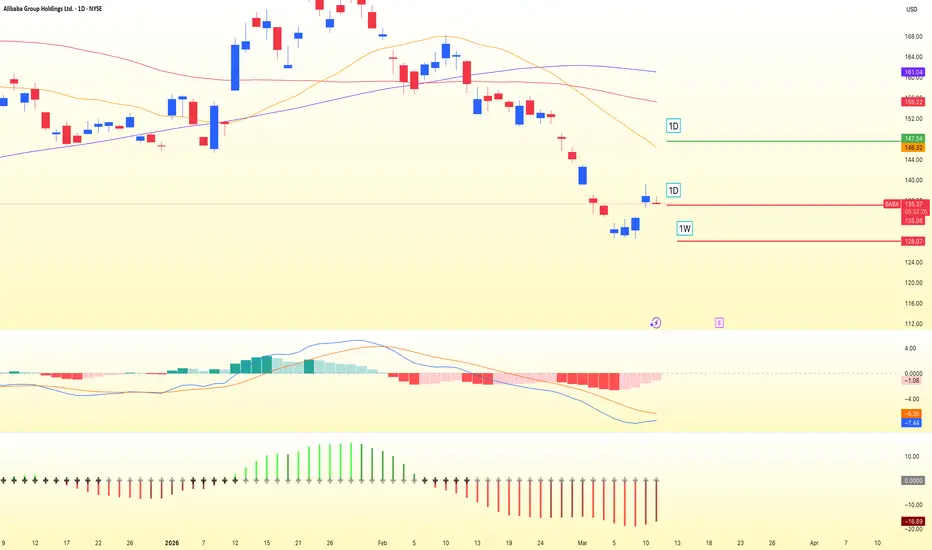
BABA is at a decisive point after a sharp loss of momentum from the $190 peak. On the 1D chart, price has broken below the MA20, MA60, and MA120, while the broader structure has shifted into a confirmed descending channel. Trading near $135.57, the stock is now pressing against a fragile support area, with bearish momentum still dominant across MACD, SQZMOM, and SuperTrend. The weekly chart adds to that caution, with price testing the MA60 near $137.75 while the medium-term rally structure begins to look exhausted.
The primary path remains bearish unless Alibaba can reclaim the broken resistance zone. Support sits at $128.55, and a daily close below $135.00 would strengthen the continuation case toward $128.00 first, then potentially $120.00. If the weekly structure gives way with a close below $128.00, that would open the door to a deeper macro breakdown toward $100.00. For now, sellers still control the tape, and every failed bounce into resistance keeps that pressure intact.
The alternative scenario is a relief rally, but it needs proof. A daily close above $148.00 would signal a break of the channel’s upper boundary and a reclaim of the $146.33 resistance zone, which could shift the move toward $155.00 and possibly $170.00. Until that happens, rebounds look more like mean-reversion than trend reversal
The primary path remains bearish unless Alibaba can reclaim the broken resistance zone. Support sits at $128.55, and a daily close below $135.00 would strengthen the continuation case toward $128.00 first, then potentially $120.00. If the weekly structure gives way with a close below $128.00, that would open the door to a deeper macro breakdown toward $100.00. For now, sellers still control the tape, and every failed bounce into resistance keeps that pressure intact.
The alternative scenario is a relief rally, but it needs proof. A daily close above $148.00 would signal a break of the channel’s upper boundary and a reclaim of the $146.33 resistance zone, which could shift the move toward $155.00 and possibly $170.00. Until that happens, rebounds look more like mean-reversion than trend reversal

follow my X 👉 x.com/bbqgio
🔥 level up your Stock, FX, & Crypto: VIP access to AI technical analysis and pro market insights at TradeOS + 50%-off promo code ONBOARD 👉
ai.tradeos.xyz/?utm_source=tvbg
🔥 level up your Stock, FX, & Crypto: VIP access to AI technical analysis and pro market insights at TradeOS + 50%-off promo code ONBOARD 👉
ai.tradeos.xyz/?utm_source=tvbg
Publicações relacionadas
Aviso legal
As informações e publicações não se destinam a ser, e não constituem, conselhos ou recomendações financeiras, de investimento, comerciais ou de outro tipo fornecidos ou endossados pela TradingView. Leia mais nos Termos de Uso.
follow my X 👉 x.com/bbqgio
🔥 level up your Stock, FX, & Crypto: VIP access to AI technical analysis and pro market insights at TradeOS + 50%-off promo code ONBOARD 👉
ai.tradeos.xyz/?utm_source=tvbg
🔥 level up your Stock, FX, & Crypto: VIP access to AI technical analysis and pro market insights at TradeOS + 50%-off promo code ONBOARD 👉
ai.tradeos.xyz/?utm_source=tvbg
Publicações relacionadas
Aviso legal
As informações e publicações não se destinam a ser, e não constituem, conselhos ou recomendações financeiras, de investimento, comerciais ou de outro tipo fornecidos ou endossados pela TradingView. Leia mais nos Termos de Uso.