
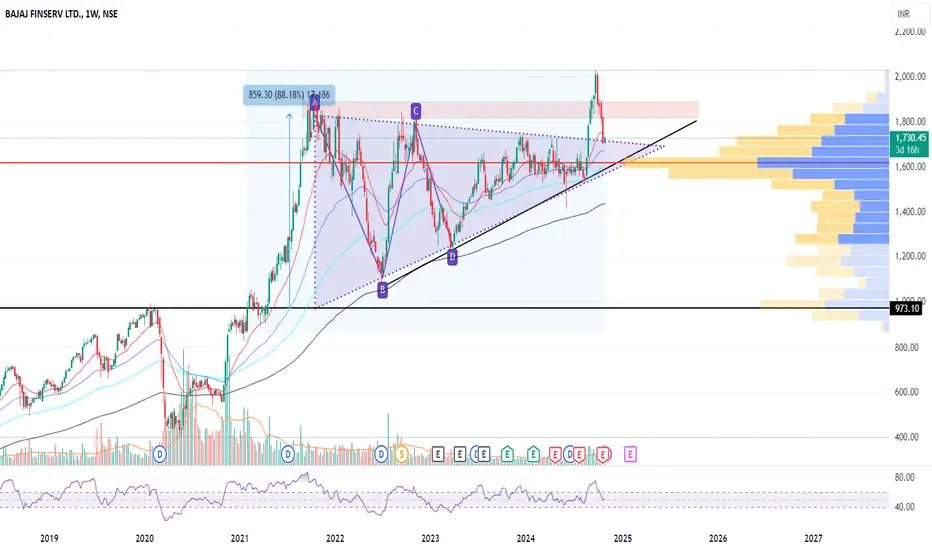
1. Symmetrical Triangle Pattern:
2. Recent Breakout and Pullback:
3. Fibonacci Levels and Potential Resistance Zones:
4. Volume Profile Analysis:
5. Trendline Support and Moving Averages:
6. RSI and Momentum Indicators:
7. Key Levels to Watch:
Conclusion: The stock is at a critical juncture, currently retesting the breakout level of the symmetrical triangle. If the price sustains above INR 1,730, we could see a bullish continuation toward INR 1,880. However, a breakdown below the trendline or INR 1,500 could invalidate the bullish outlook, potentially leading to further downside.
- Bajaj Finserv has been consolidating within a symmetrical triangle pattern over the past few years, showing lower highs and higher lows.
- This pattern suggests a period of accumulation or consolidation, where both buyers and sellers are competing, leading to a breakout or breakdown.
2. Recent Breakout and Pullback:
- The price recently broke above the upper boundary of the triangle, indicating a bullish breakout, which was accompanied by significant buying volume.
- Currently, the price is retesting the breakout level, which may act as a support zone if it holds.
3. Fibonacci Levels and Potential Resistance Zones:
- The previous high near INR 1,880 (approx.) acts as a critical resistance zone. This level also aligns with the 88.18% Fibonacci retracement level, which may serve as a potential profit-booking zone if the stock moves upward again.
- If the stock maintains its momentum post-retest, a move toward this resistance could be expected.
4. Volume Profile Analysis:
- The Volume Profile on the right shows strong support around the INR 1,500-1,600 levels, indicating that a significant volume of shares has been traded within this range.
- This level may act as a support if the price dips further from the current pullback.
5. Trendline Support and Moving Averages:
- The long-term upward trendline provides a strong dynamic support level.
- The 50-week and 200-week moving averages are positioned below the price, indicating a long-term uptrend and offering additional support around INR 1,500.
6. RSI and Momentum Indicators:
- The Relative Strength Index (RSI) shows a healthy range but is not overbought, suggesting there is room for further upward movement.
- A crossover in the RSI or any divergence may indicate potential reversals, so keeping an eye on these indicators would be beneficial.
7. Key Levels to Watch:
- Support: INR 1,500-1,600 (Volume Profile and Moving Average Support), INR 1,730 (current retest level).
- Resistance: INR 1,880 (previous high and Fibonacci level).
Conclusion: The stock is at a critical juncture, currently retesting the breakout level of the symmetrical triangle. If the price sustains above INR 1,730, we could see a bullish continuation toward INR 1,880. However, a breakdown below the trendline or INR 1,500 could invalidate the bullish outlook, potentially leading to further downside.

Aviso legal
As informações e publicações não se destinam a ser, e não constituem, conselhos ou recomendações financeiras, de investimento, comerciais ou de outro tipo fornecidos ou endossados pela TradingView. Leia mais nos Termos de Uso.
Aviso legal
As informações e publicações não se destinam a ser, e não constituem, conselhos ou recomendações financeiras, de investimento, comerciais ou de outro tipo fornecidos ou endossados pela TradingView. Leia mais nos Termos de Uso.