
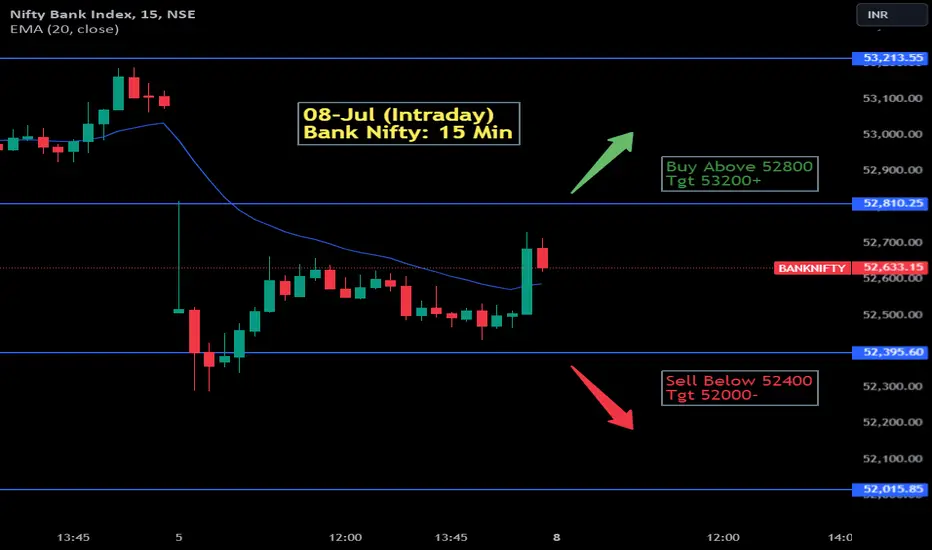
The chart you provided is a 15-minute intraday chart for Bank Nifty with trading levels and strategies for July 8th. Here’s a breakdown of the key points on the chart:
Buy Signal:
-Buy above 52800
-Target: 53200+
Indicated by a green arrow pointing upwards.
Sell Signal:
-Sell below 52400
-Target: 52000-
-Indicated by a red arrow pointing downwards.
Resistance Levels:
-Around 53,213.55
-Around 53,100.00
Support Levels:
-Around 52,587.14 (EMA 20 close)
-Around 52,810.25
-Around 52,395.60
-Around 52,015.85
Current Price:
Bank Nifty is at 52,633.15, showing a slight decrease (-0.10%).

Aviso legal
As informações e publicações não se destinam a ser, e não constituem, conselhos ou recomendações financeiras, de investimento, comerciais ou de outro tipo fornecidos ou endossados pela TradingView. Leia mais nos Termos de Uso.
Aviso legal
As informações e publicações não se destinam a ser, e não constituem, conselhos ou recomendações financeiras, de investimento, comerciais ou de outro tipo fornecidos ou endossados pela TradingView. Leia mais nos Termos de Uso.