
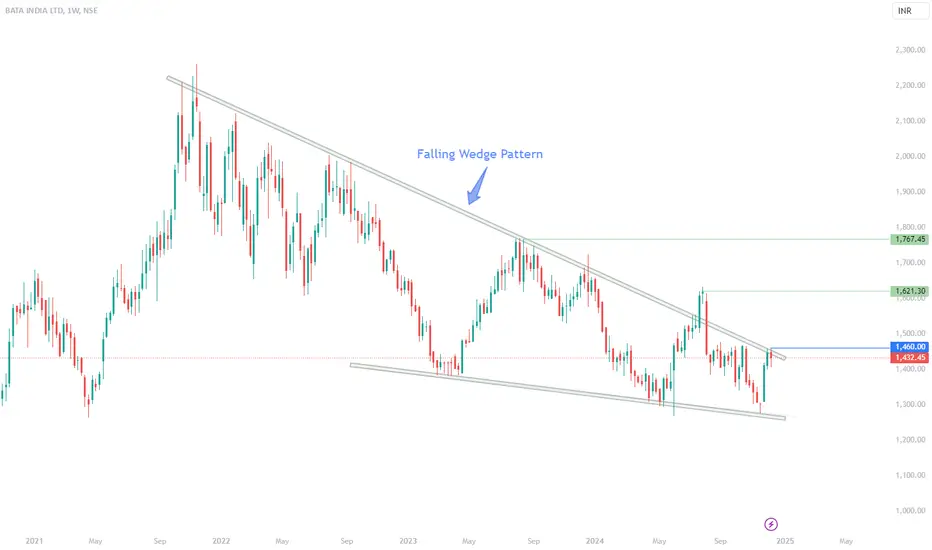
Weekly chart of BATA shows a beautiful Falling Wedge pattern.
The last candle is an inside candle from the previous week, suggesting a brief pause before the up move.
Any break above 1460 can result in a good move on the upside.
Fall below 1400 may be a continuation of the falling wedge pattern.
The last candle is an inside candle from the previous week, suggesting a brief pause before the up move.
Any break above 1460 can result in a good move on the upside.
Fall below 1400 may be a continuation of the falling wedge pattern.

Aviso legal
As informações e publicações não se destinam a ser, e não constituem, conselhos ou recomendações financeiras, de investimento, comerciais ou de outro tipo fornecidos ou endossados pela TradingView. Leia mais nos Termos de Uso.
Aviso legal
As informações e publicações não se destinam a ser, e não constituem, conselhos ou recomendações financeiras, de investimento, comerciais ou de outro tipo fornecidos ou endossados pela TradingView. Leia mais nos Termos de Uso.