
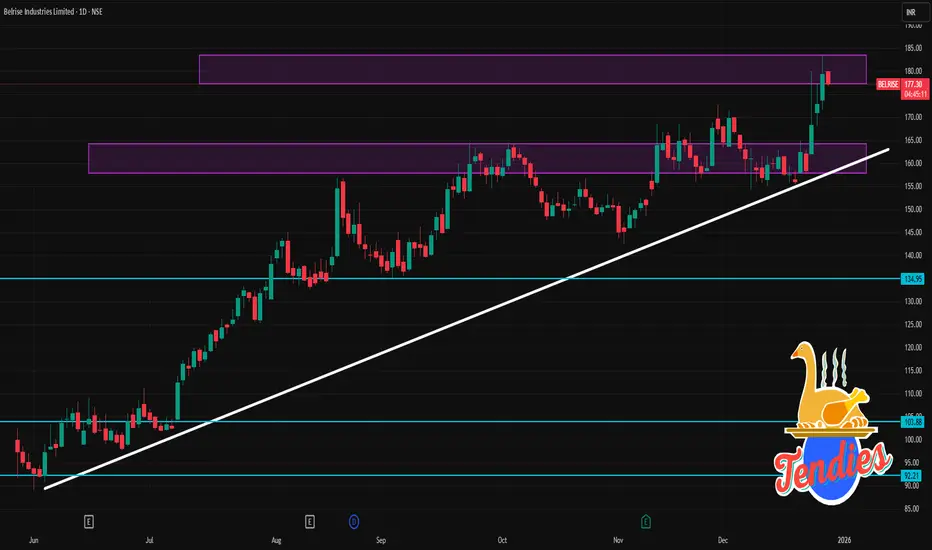
📈 Current Price Context
The stock is trading around ₹177-179 range recently.
📊 Daily Pivot & Levels (Important for intraday/day-trading)
Central Pivot (approx): ~ ₹178.17 (Daily pivot)
🔼 Resistance Levels
R1: ₹184.66
R2: ₹189.92
R3: ₹196.41
(These are daily resistance benchmarks where price may face selling pressure)
🔽 Support Levels
S1: ₹172.91
S2: ₹166.42
S3: ₹161.16
(These act as floor levels where price may find buying interest)
📍 These supports and resistances are typical pivot-based levels used by traders for intraday and next-day decision making.
📉 Additional Technical Zones
🟢 Bullish / Momentum Indicators
The stock’s RSI has been elevated (suggesting bullish momentum near overbought) around mid-60s to high-60s.
Moving averages (5-, 10-, 20-DMA) are below price, typically a bullish structure.
🟡 Volatility & Trend
ATR (Average True Range) suggests typical daily movement range ~ ₹7–8, useful to estimate realistic targets/stop levels.
🧠 Short-Term Intraday Strategy Notes (General Guidance)
Note: This is not financial advice—only common technical ideas traders use.
Bullish intraday view:
Long above pivot with stop just below S1, target R1/R2.
Bearish intraday view:
Short if price rejects resistance levels (R1/R2) with stop above next resistance.
Volatility play:
Expect moves within the ~₹172–185 range most of the day unless new news breaks (block deals, earnings, etc.).
The stock is trading around ₹177-179 range recently.
📊 Daily Pivot & Levels (Important for intraday/day-trading)
Central Pivot (approx): ~ ₹178.17 (Daily pivot)
🔼 Resistance Levels
R1: ₹184.66
R2: ₹189.92
R3: ₹196.41
(These are daily resistance benchmarks where price may face selling pressure)
🔽 Support Levels
S1: ₹172.91
S2: ₹166.42
S3: ₹161.16
(These act as floor levels where price may find buying interest)
📍 These supports and resistances are typical pivot-based levels used by traders for intraday and next-day decision making.
📉 Additional Technical Zones
🟢 Bullish / Momentum Indicators
The stock’s RSI has been elevated (suggesting bullish momentum near overbought) around mid-60s to high-60s.
Moving averages (5-, 10-, 20-DMA) are below price, typically a bullish structure.
🟡 Volatility & Trend
ATR (Average True Range) suggests typical daily movement range ~ ₹7–8, useful to estimate realistic targets/stop levels.
🧠 Short-Term Intraday Strategy Notes (General Guidance)
Note: This is not financial advice—only common technical ideas traders use.
Bullish intraday view:
Long above pivot with stop just below S1, target R1/R2.
Bearish intraday view:
Short if price rejects resistance levels (R1/R2) with stop above next resistance.
Volatility play:
Expect moves within the ~₹172–185 range most of the day unless new news breaks (block deals, earnings, etc.).

Contact Knowledgehub for a detailed consultation: Dm on WhatsApp: [wa.link/a2o0kz]-
Phone No: [+91 93102 26243]-
Email: [tradingviewknowledgehub@gmail.com]---
-- Let’s achieve success together!
Phone No: [+91 93102 26243]-
Email: [tradingviewknowledgehub@gmail.com]---
-- Let’s achieve success together!
Publicações relacionadas
Aviso legal
As informações e publicações não se destinam a ser, e não constituem, conselhos ou recomendações financeiras, de investimento, comerciais ou de outro tipo fornecidos ou endossados pela TradingView. Leia mais nos Termos de Uso.
Contact Knowledgehub for a detailed consultation: Dm on WhatsApp: [wa.link/a2o0kz]-
Phone No: [+91 93102 26243]-
Email: [tradingviewknowledgehub@gmail.com]---
-- Let’s achieve success together!
Phone No: [+91 93102 26243]-
Email: [tradingviewknowledgehub@gmail.com]---
-- Let’s achieve success together!
Publicações relacionadas
Aviso legal
As informações e publicações não se destinam a ser, e não constituem, conselhos ou recomendações financeiras, de investimento, comerciais ou de outro tipo fornecidos ou endossados pela TradingView. Leia mais nos Termos de Uso.