
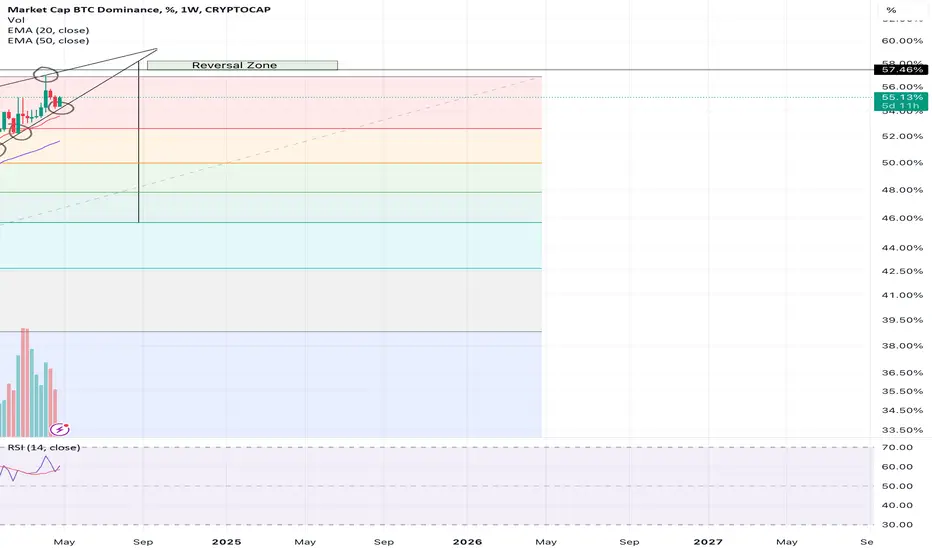
BTC.D is in rising wedge since Nov 2022. It's getting closer to the apex area. 82% rising wedges break towards downside. It seems that BTC will chop around in this after halving period, takes liquidity from both sides, and then will have a parabolic move by Aug-Sept 2024. Once BTC.D reaches the reversal zone range of 56-58%, it should break this rising wedge if not before. It's TP should be 45.7% which is a 0.618 fib level. ALTS should rally hard in the Q4 2024 if this TA works out.
Trade fechado manualmente
Discard this Idea. I have posted this in a new thread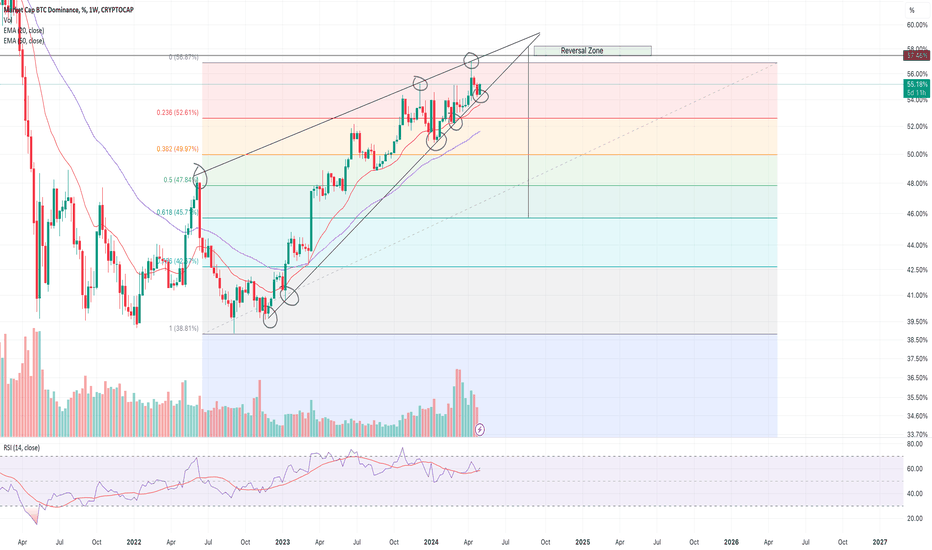

Aviso legal
As informações e publicações não se destinam a ser, e não constituem, conselhos ou recomendações financeiras, de investimento, comerciais ou de outro tipo fornecidos ou endossados pela TradingView. Leia mais nos Termos de Uso.
Aviso legal
As informações e publicações não se destinam a ser, e não constituem, conselhos ou recomendações financeiras, de investimento, comerciais ou de outro tipo fornecidos ou endossados pela TradingView. Leia mais nos Termos de Uso.