
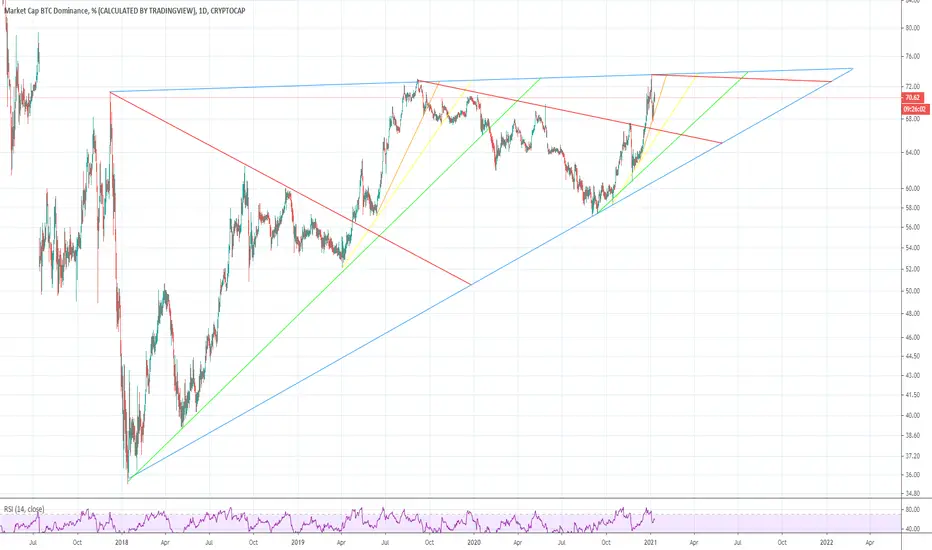
Same idea as the first chart I poasted a week ago but now the paranoid schizophrenic has found EVEN MORE patterns in the numbers!
The colored support lines that we are ranging through right now seem to be a scaled down fractal of the price action we saw in fall of 2019.
As of this chart's publishing date, we have just bounced off of the first orange support line, just like we did a couple years ago.
Will be looking for more confirmation to see if price action continues to mirror the previous iteration.
The colored support lines that we are ranging through right now seem to be a scaled down fractal of the price action we saw in fall of 2019.
As of this chart's publishing date, we have just bounced off of the first orange support line, just like we did a couple years ago.
Will be looking for more confirmation to see if price action continues to mirror the previous iteration.

Aviso legal
As informações e publicações não se destinam a ser, e não constituem, conselhos ou recomendações financeiras, de investimento, comerciais ou de outro tipo fornecidos ou endossados pela TradingView. Leia mais nos Termos de Uso.
Aviso legal
As informações e publicações não se destinam a ser, e não constituem, conselhos ou recomendações financeiras, de investimento, comerciais ou de outro tipo fornecidos ou endossados pela TradingView. Leia mais nos Termos de Uso.