
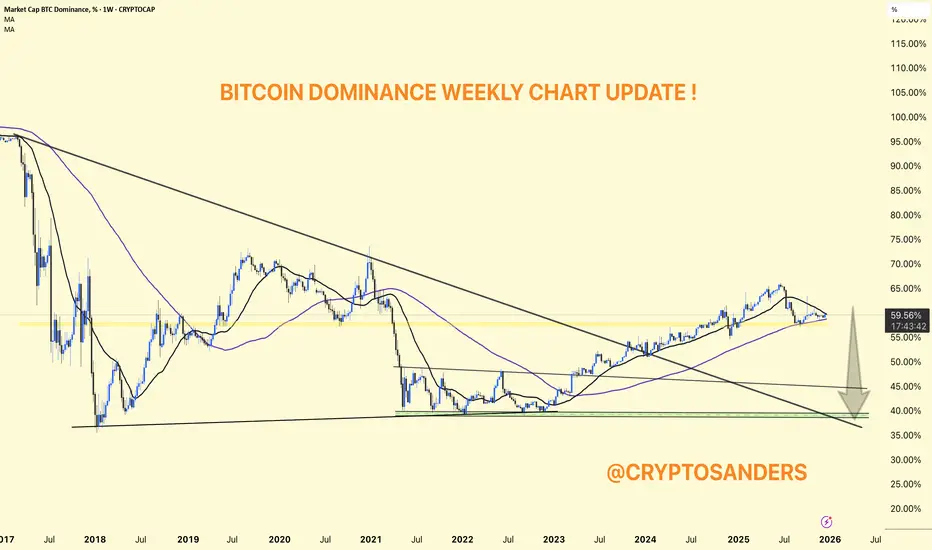
BTC Dominance (BTC.D) – Weekly Chart | Full Details (with 25MA and 100 MA)
BTC.D is trading within a long-term descending channel. After a strong recovery from the 2022 lows, the dominance is now stalling near the mid-range resistance (~59–60%).
25 MA: Tracks short-term momentum
BTC.D is hovering around/slightly below the 25 MA.
100 MA: The price is still above the 100 MA, meaning the overall BTC dominance trend has not yet broken down.
A break below the 100 MA would signal a significant shift towards altcoin strength.
This is a decision zone.
BTC dominance is not yet bearish, but the strength of the uptrend is weakening.
Keep a close eye on the MA — they will guide the next move.
DYOR | NFA
BTC.D is trading within a long-term descending channel. After a strong recovery from the 2022 lows, the dominance is now stalling near the mid-range resistance (~59–60%).
25 MA: Tracks short-term momentum
BTC.D is hovering around/slightly below the 25 MA.
100 MA: The price is still above the 100 MA, meaning the overall BTC dominance trend has not yet broken down.
A break below the 100 MA would signal a significant shift towards altcoin strength.
This is a decision zone.
BTC dominance is not yet bearish, but the strength of the uptrend is weakening.
Keep a close eye on the MA — they will guide the next move.
DYOR | NFA

Publicações relacionadas
Aviso legal
As informações e publicações não se destinam a ser, e não constituem, conselhos ou recomendações financeiras, de investimento, comerciais ou de outro tipo fornecidos ou endossados pela TradingView. Leia mais nos Termos de Uso.
Publicações relacionadas
Aviso legal
As informações e publicações não se destinam a ser, e não constituem, conselhos ou recomendações financeiras, de investimento, comerciais ou de outro tipo fornecidos ou endossados pela TradingView. Leia mais nos Termos de Uso.