
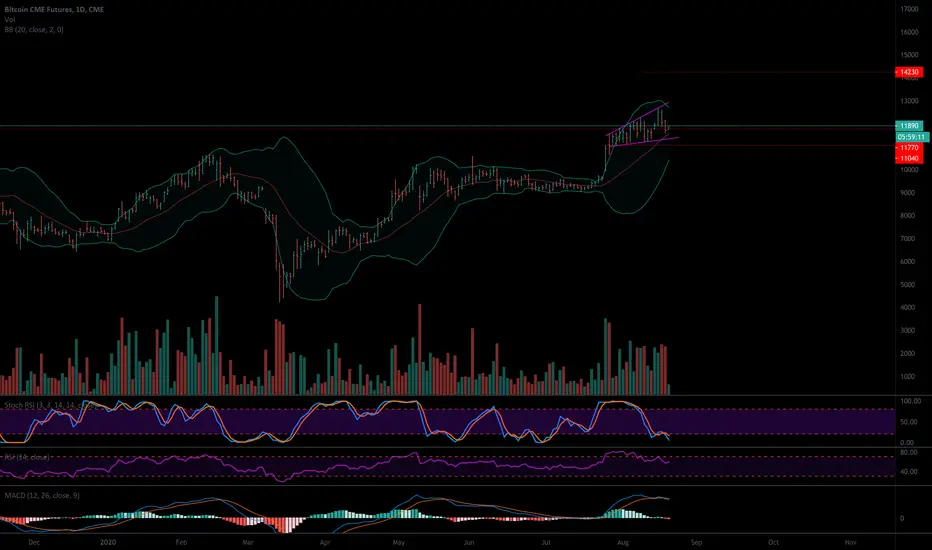
Based on the ascending broadening wedge formed on the CME chart, Bitcoin has a 52% to break down to approx. $11K. However, that means that it has a 48% chance to break to approx. $14K. What do you think? MACD is indicating a break lower. However, here is the good news! These patterns don't typically form in bear markets! They form in BULL markets, so that's interesting evidence pointing to a bull market in Bitcoin! I am LONG, long-term! LET'S GO BULLS! :-)

Aviso legal
As informações e publicações não se destinam a ser, e não constituem, conselhos ou recomendações financeiras, de investimento, comerciais ou de outro tipo fornecidos ou endossados pela TradingView. Leia mais nos Termos de Uso.
Aviso legal
As informações e publicações não se destinam a ser, e não constituem, conselhos ou recomendações financeiras, de investimento, comerciais ou de outro tipo fornecidos ou endossados pela TradingView. Leia mais nos Termos de Uso.