
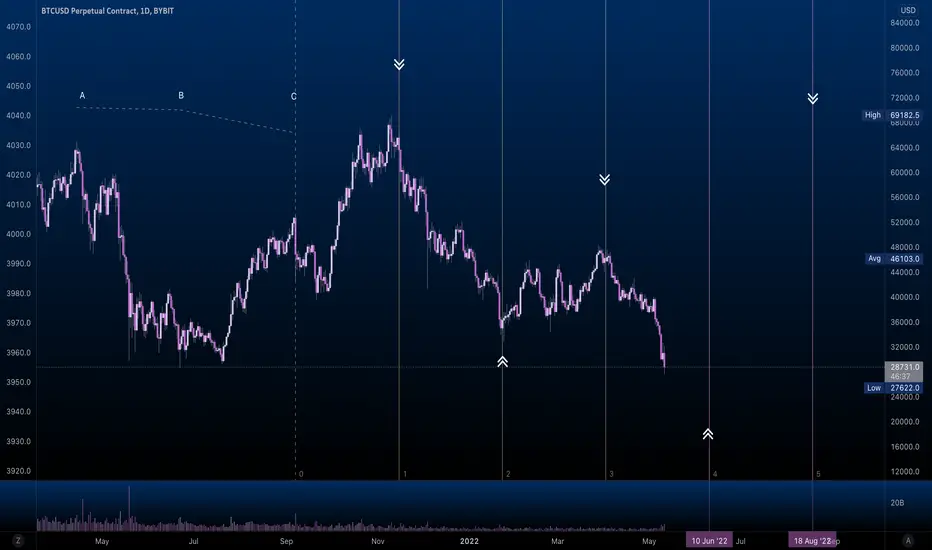
Take the April high, June low and extend from Sept high. Use 1:1 time ratios of A->B. Pretty much times every major pivot. To take this further and get a more accurate answer, use older pivots on another chart perhaps. I noticed that using negative 1:1 values also showed confluence, however it's slightly off.

Aviso legal
As informações e publicações não se destinam a ser, e não constituem, conselhos ou recomendações financeiras, de investimento, comerciais ou de outro tipo fornecidos ou endossados pela TradingView. Leia mais nos Termos de Uso.
Aviso legal
As informações e publicações não se destinam a ser, e não constituem, conselhos ou recomendações financeiras, de investimento, comerciais ou de outro tipo fornecidos ou endossados pela TradingView. Leia mais nos Termos de Uso.