
Hello
It's a Bitcoin Guide.
My analysis is optimized for TradingView.
If you press the Replay button, you can check real-time movements.

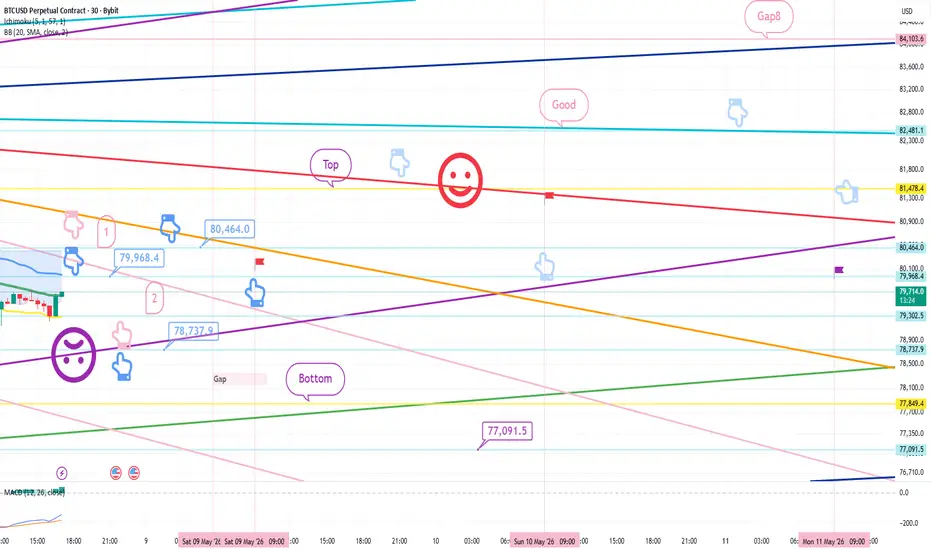
This is the Bitcoin 30-minute chart.
Currently, a MACD Dead Cross is in progress on the 12-hour and daily charts.
*Short -> Long switching based on the movement path of the light blue finger; this is a two-way neutral strategy.
1) Light blue finger: $79,968.4 is the entry point for the short position / Stop loss if the orange resistance line is broken.
2) $78,737.9 is the switch to the long position / Stop loss if the purple support line is broken.
3) $80,464 is the first target for the long position -> Target prices will be set in the order of Top and Good during the weekend.
Since the MACD Dead Cross on the daily chart is still ongoing, sideways movement or a correction may occur until tomorrow.
However, if the Top zone is strongly broken, the signal may be ignored.
- Please note that depending on the rebound from the current position, the movement may connect from the indicated pink finger #1 to #2. Please be cautious, as a break below the purple support line could lead to a drop of up to 77K.
Please use my analysis merely as a reference and for practical purposes.
I hope you operate safely by adhering to trading principles and strictly using stop-loss orders.
Thank you.
It's a Bitcoin Guide.
My analysis is optimized for TradingView.
If you press the Replay button, you can check real-time movements.
This is the Bitcoin 30-minute chart.
Currently, a MACD Dead Cross is in progress on the 12-hour and daily charts.
*Short -> Long switching based on the movement path of the light blue finger; this is a two-way neutral strategy.
1) Light blue finger: $79,968.4 is the entry point for the short position / Stop loss if the orange resistance line is broken.
2) $78,737.9 is the switch to the long position / Stop loss if the purple support line is broken.
3) $80,464 is the first target for the long position -> Target prices will be set in the order of Top and Good during the weekend.
Since the MACD Dead Cross on the daily chart is still ongoing, sideways movement or a correction may occur until tomorrow.
However, if the Top zone is strongly broken, the signal may be ignored.
- Please note that depending on the rebound from the current position, the movement may connect from the indicated pink finger #1 to #2. Please be cautious, as a break below the purple support line could lead to a drop of up to 77K.
Please use my analysis merely as a reference and for practical purposes.
I hope you operate safely by adhering to trading principles and strictly using stop-loss orders.
Thank you.
Trade fechado: stop atingido
Hello.This is the Bitcoin Guide.
Let's check the movements since the analysis post was written on May 8th.
This is the Bitcoin 30-minute chart.
I have marked the key zones with black fingers.
In the pink finger short-to-long switching strategy,
after entering a short position at $80,464 in Zone 1 at the top,
it finished in a sideways market.
Over the weekend, it did not drop to Zone 2 at the bottom,
but rose near the Top -> Good level,
and is currently undergoing a strong correction.
Unfortunately, the strategy was executed as a stop loss.
On the daily chart, the MACD dead cross continues,
and due to last week's movements, a Gap 10 zone has formed at the bottom.
I will explain the details together in today's analysis post.
Thank you.

[Bitcoin Guide Affiliate]
*Bybit 20%DC Lifetime + $30,100
partner.bybit.com/b/Bitcoin_Guide
*BingX 50%DC + $14,100
bit.ly/3E8ZkAW
*ZeroMarket ECN 40%DC
bit.ly/3pY0dUv
*Telegram
t.me/bitcoinguide_TM
*Bybit 20%DC Lifetime + $30,100
partner.bybit.com/b/Bitcoin_Guide
*BingX 50%DC + $14,100
bit.ly/3E8ZkAW
*ZeroMarket ECN 40%DC
bit.ly/3pY0dUv
*Telegram
t.me/bitcoinguide_TM
Publicações relacionadas
Aviso legal
As informações e publicações não se destinam a ser, e não constituem, conselhos ou recomendações financeiras, de investimento, comerciais ou de outro tipo fornecidos ou endossados pela TradingView. Leia mais nos Termos de Uso.