
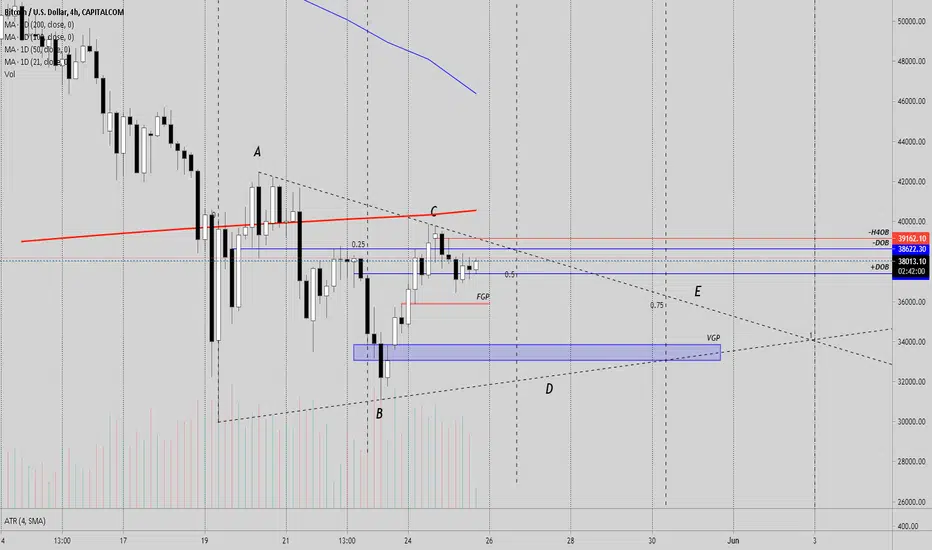
Bitcoin - After digging further into recent price action of Bitcoin on the 4 hour chart by clearing off the chart and removing previous analysis, I have discovered that we could be having some type of sideways pennant pattern forming. Pennants usually form after a very long bull or bear run and usually take one to three weeks to form. In the chart above I have laid out the anticipated projection of this sideways pennant with the relative percentages of completion. It is anticipated that we will have bearish and bullish legs forming up into June at which time we should see a continuation of the downtrend.
**** This is my own analysis and not trading advice.
**** This is my own analysis and not trading advice.

Publicações relacionadas
Aviso legal
As informações e publicações não se destinam a ser, e não constituem, conselhos ou recomendações financeiras, de investimento, comerciais ou de outro tipo fornecidos ou endossados pela TradingView. Leia mais nos Termos de Uso.
Publicações relacionadas
Aviso legal
As informações e publicações não se destinam a ser, e não constituem, conselhos ou recomendações financeiras, de investimento, comerciais ou de outro tipo fornecidos ou endossados pela TradingView. Leia mais nos Termos de Uso.