
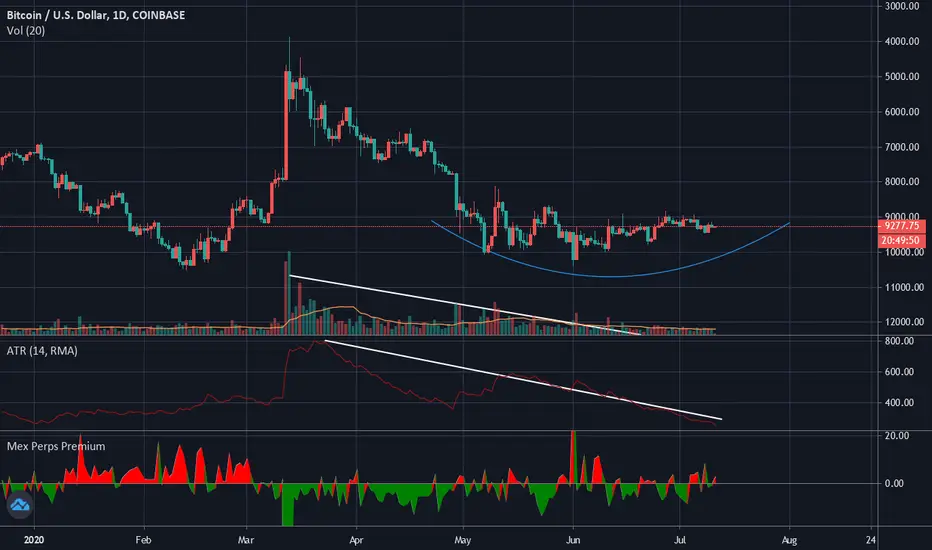
I've always found it hard to understand the chart for the bears as I am naturally bullish.. The inverted chart can give us a better feel of how the bears are doing. As you can see the bears have formed an arc of resistance and a big move is coming. Volatility and volume is decreasing. 9800 area is a significant area and perfect coincides with fibonnaci resistance. If the bulls are able to break through 9800 then we can expect a market rally, but with the fundamentals of the economy being weak because of corona virus be careful longing!
That is all for this analysis. If you guys think this analysis is correct please hit the thumbs up button and follow me for more analysis in the future!
That is all for this analysis. If you guys think this analysis is correct please hit the thumbs up button and follow me for more analysis in the future!
Trade ativo
Latest daily trading journal entry Check out my portfolio. : youtube.com/watch?v=9tZSK_1MSCE
Trade ativo
Dropped $100. But still waiting for that massive rug pull. Check out my TA and my portfolio's performance thus far here:
youtu.be/KhoJlAK1XUs

Aviso legal
As informações e publicações não se destinam a ser, e não constituem, conselhos ou recomendações financeiras, de investimento, comerciais ou de outro tipo fornecidos ou endossados pela TradingView. Leia mais nos Termos de Uso.
Aviso legal
As informações e publicações não se destinam a ser, e não constituem, conselhos ou recomendações financeiras, de investimento, comerciais ou de outro tipo fornecidos ou endossados pela TradingView. Leia mais nos Termos de Uso.