
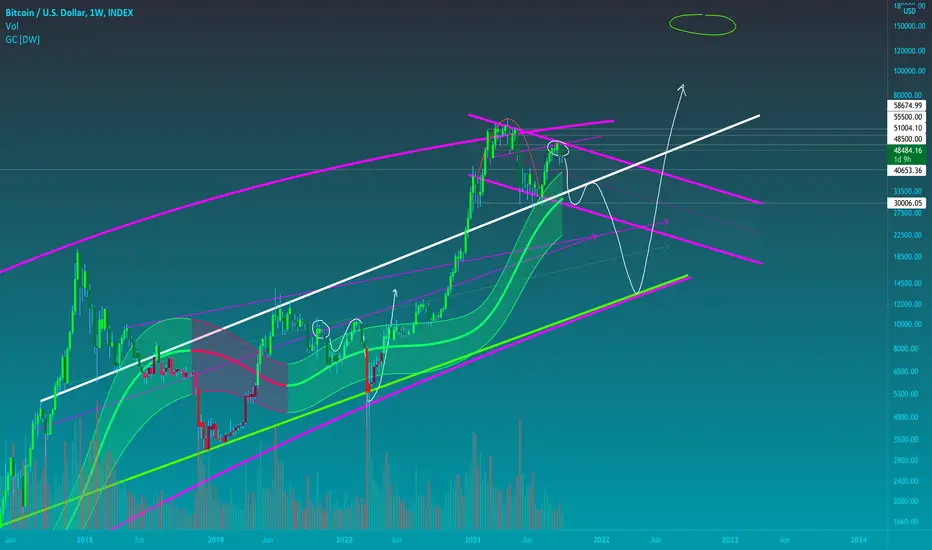
Using the channel indicator on a logarithmic scale, you can see strong similarity of our current bull run vs 2019 bull run.
After first large dump, market bounces off top of channel and uses it as support.
Following this, it bounces off the 50% line within the channel and heads to a strong resistance on a trend line (white one)
We then see a dump through the bottom of the channel which then lands on a strong logarithmic curve line(thick purple) and a logarithmic trend line(thick green)
After this, the bottom is set and a new bull run can commence. Target at 100k plus.
After first large dump, market bounces off top of channel and uses it as support.
Following this, it bounces off the 50% line within the channel and heads to a strong resistance on a trend line (white one)
We then see a dump through the bottom of the channel which then lands on a strong logarithmic curve line(thick purple) and a logarithmic trend line(thick green)
After this, the bottom is set and a new bull run can commence. Target at 100k plus.

Aviso legal
As informações e publicações não se destinam a ser, e não constituem, conselhos ou recomendações financeiras, de investimento, comerciais ou de outro tipo fornecidos ou endossados pela TradingView. Leia mais nos Termos de Uso.
Aviso legal
As informações e publicações não se destinam a ser, e não constituem, conselhos ou recomendações financeiras, de investimento, comerciais ou de outro tipo fornecidos ou endossados pela TradingView. Leia mais nos Termos de Uso.