
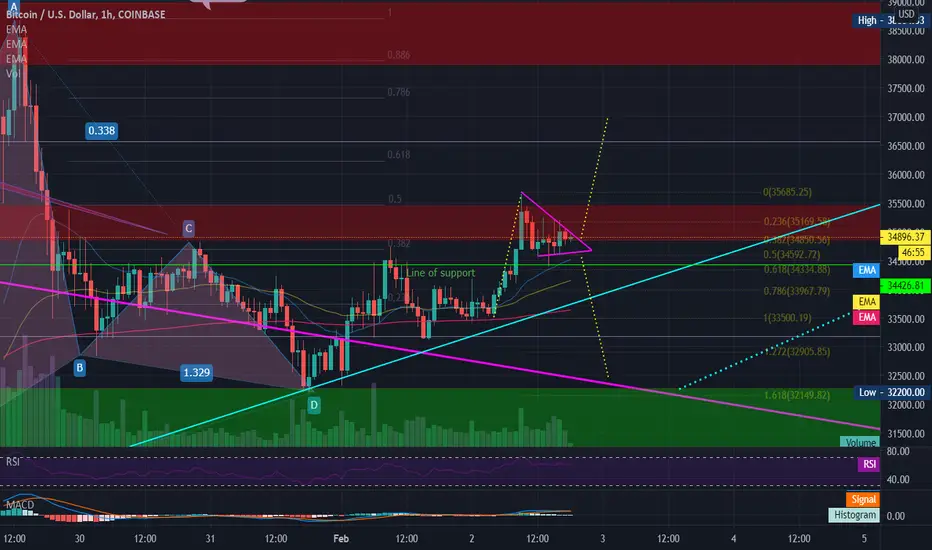
Looking at the 1hr chart it looks like Bitcoin has been rounding up it's pups and is ready to make a break for it.
The measured move up would give us a target above the red resistance box. I'll be looking for a back test to flip it to support if we get up above $35,500 again.
If we break down then I will be looking at several areas for support, the first being the .5 to .618 Fib retrace of the last move. About $32,200 would be my target for the downside and I'd be looking for a hard bounce from there.
Here is the daily chart. Is that an inverted head and shoulders?

If you twist my whiskers I'll admit my bullish bias.
The trend is our friend until it ends!
Owhooooo!
The measured move up would give us a target above the red resistance box. I'll be looking for a back test to flip it to support if we get up above $35,500 again.
If we break down then I will be looking at several areas for support, the first being the .5 to .618 Fib retrace of the last move. About $32,200 would be my target for the downside and I'd be looking for a hard bounce from there.
Here is the daily chart. Is that an inverted head and shoulders?
If you twist my whiskers I'll admit my bullish bias.
The trend is our friend until it ends!
Owhooooo!
Nota
RAOWFF! Nota
A back test on the 4hr (or 1hr) or a continuation of the measured move?Nota
The very rare Sleeping Dragon...we all know what happens when it awakens! Owhooooo!
Nota
Nota
The dragon is awake! $37,900 I think is the next stop!
Aviso legal
As informações e publicações não se destinam a ser, e não constituem, conselhos ou recomendações financeiras, de investimento, comerciais ou de outro tipo fornecidos ou endossados pela TradingView. Leia mais nos Termos de Uso.
Aviso legal
As informações e publicações não se destinam a ser, e não constituem, conselhos ou recomendações financeiras, de investimento, comerciais ou de outro tipo fornecidos ou endossados pela TradingView. Leia mais nos Termos de Uso.