
Generated: 2026-03-26 11:14 ET
📊 Multi-Timeframe Snapshot: March 26, 2026
Bitcoin is navigating a critical inflection point where short- and medium-term bearish pressure collides with a longer-term structural bull case. Understanding which timeframe matters for your trading horizon is essential right now.
🔴 Daily: Bearish Window Active
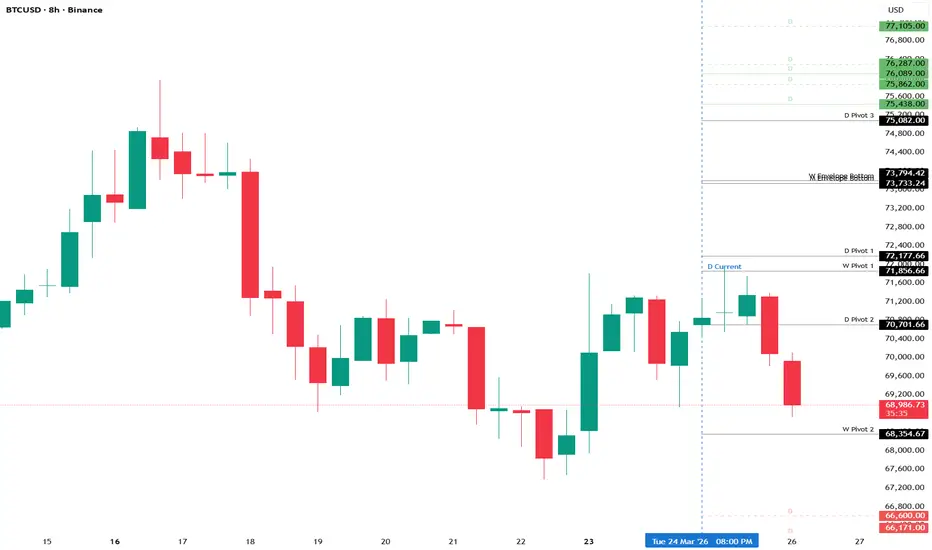
The daily setup leans decisively bearish for the near term. Price broke sharply from yesterday's close near $71,334, sliding toward $70,000 and testing a bearish convergence cluster at $70,370–$71,077. Critically, March 25 appears to have printed as a confirmed turning point — and the implication of that turn is downward into March 26–27, a period flagged as a Directional Change cluster.
The structural case: two bearish reversals elected from the March 17 high, two more from the March 22 rally, and no daily bullish reversals elected from the recent low. The nearest daily bull reversal sits at $71,621 — already above current price. Until that level is reclaimed on a daily close, the probability of upside follow-through remains low.
Key intraday level to watch: $69,705. A sustained break below this level would shift the odds toward a test of the next support cluster at $67,916–$68,040.
🔴 Weekly: Turning Back Down Into March 30
The weekly picture reinforces the bearish tilt. The week of March 16 registered as a confirmed past turning point, with timing models implying the opposite direction into the week of March 30 — the strongest weekly target on the horizon. The weekly model reads "Turning Back Down," and price has already failed at the key $71,856 pivot that would have been needed to sustain upward momentum.
Over 10 weekly bearish reversals have been elected since January 2026, with zero weekly bullish reversals active. The weight of evidence at this timeframe strongly favors continued weakness. A weekly close below $65,295 — the nearest significant weekly bearish reversal — would meaningfully increase the probability of a deeper decline.
🟢 Monthly: Long-Term Bull Case Still Alive
Zoom out and a different picture emerges. February has been confirmed as a past monthly turning point, with the timing model implying upward direction thereafter into May and a major window in July. The February low at $60,075 held above key monthly support at $58,947 — a level that has not been elected as a bearish reversal despite a 52% correction from the October 2025 high.
The monthly energy model shows a classic bullish divergence pattern: price compressed sharply while macro energy held elevated — a setup that has historically preceded powerful recoveries. Long-term and cyclical trend indicators at the monthly level remain bullish.
This does NOT override the near-term bearish setup. It means the path of least resistance on the daily and weekly is down, while the longer-term structure suggests a low may already be forming.
⚠️ Key Levels & Invalidation
Near-term resistance: $71,147–$71,621 cluster
Immediate support: $69,705
Deeper support: $67,916–$68,040
Critical weekly level: $65,295 (election here would signal next leg lower)
Long-term bull invalidation: Monthly close below $58,947
🕐 Timing Windows
March 26–27: Active daily directional change window — choppy, whipsaw risk elevated
Week of March 30: Strongest weekly timing target — high-probability pivot zone
May 2026: Next monthly timing target, potential short-term turn
July 2026: Strongest monthly target, major structural event expected
The convergence of short-term bearish momentum and longer-term structural support makes Bitcoin a market where timing your timeframe matters as much as your direction. Bears have the edge now — but the broader trend hasn't given up.
📊 Multi-Timeframe Snapshot: March 26, 2026
Bitcoin is navigating a critical inflection point where short- and medium-term bearish pressure collides with a longer-term structural bull case. Understanding which timeframe matters for your trading horizon is essential right now.
🔴 Daily: Bearish Window Active
The daily setup leans decisively bearish for the near term. Price broke sharply from yesterday's close near $71,334, sliding toward $70,000 and testing a bearish convergence cluster at $70,370–$71,077. Critically, March 25 appears to have printed as a confirmed turning point — and the implication of that turn is downward into March 26–27, a period flagged as a Directional Change cluster.
The structural case: two bearish reversals elected from the March 17 high, two more from the March 22 rally, and no daily bullish reversals elected from the recent low. The nearest daily bull reversal sits at $71,621 — already above current price. Until that level is reclaimed on a daily close, the probability of upside follow-through remains low.
Key intraday level to watch: $69,705. A sustained break below this level would shift the odds toward a test of the next support cluster at $67,916–$68,040.
🔴 Weekly: Turning Back Down Into March 30
The weekly picture reinforces the bearish tilt. The week of March 16 registered as a confirmed past turning point, with timing models implying the opposite direction into the week of March 30 — the strongest weekly target on the horizon. The weekly model reads "Turning Back Down," and price has already failed at the key $71,856 pivot that would have been needed to sustain upward momentum.
Over 10 weekly bearish reversals have been elected since January 2026, with zero weekly bullish reversals active. The weight of evidence at this timeframe strongly favors continued weakness. A weekly close below $65,295 — the nearest significant weekly bearish reversal — would meaningfully increase the probability of a deeper decline.
🟢 Monthly: Long-Term Bull Case Still Alive
Zoom out and a different picture emerges. February has been confirmed as a past monthly turning point, with the timing model implying upward direction thereafter into May and a major window in July. The February low at $60,075 held above key monthly support at $58,947 — a level that has not been elected as a bearish reversal despite a 52% correction from the October 2025 high.
The monthly energy model shows a classic bullish divergence pattern: price compressed sharply while macro energy held elevated — a setup that has historically preceded powerful recoveries. Long-term and cyclical trend indicators at the monthly level remain bullish.
This does NOT override the near-term bearish setup. It means the path of least resistance on the daily and weekly is down, while the longer-term structure suggests a low may already be forming.
⚠️ Key Levels & Invalidation
Near-term resistance: $71,147–$71,621 cluster
Immediate support: $69,705
Deeper support: $67,916–$68,040
Critical weekly level: $65,295 (election here would signal next leg lower)
Long-term bull invalidation: Monthly close below $58,947
🕐 Timing Windows
March 26–27: Active daily directional change window — choppy, whipsaw risk elevated
Week of March 30: Strongest weekly timing target — high-probability pivot zone
May 2026: Next monthly timing target, potential short-term turn
July 2026: Strongest monthly target, major structural event expected
The convergence of short-term bearish momentum and longer-term structural support makes Bitcoin a market where timing your timeframe matters as much as your direction. Bears have the edge now — but the broader trend hasn't given up.

Aviso legal
As informações e publicações não se destinam a ser, e não constituem, conselhos ou recomendações financeiras, de investimento, comerciais ou de outro tipo fornecidos ou endossados pela TradingView. Leia mais nos Termos de Uso.
Aviso legal
As informações e publicações não se destinam a ser, e não constituem, conselhos ou recomendações financeiras, de investimento, comerciais ou de outro tipo fornecidos ou endossados pela TradingView. Leia mais nos Termos de Uso.