
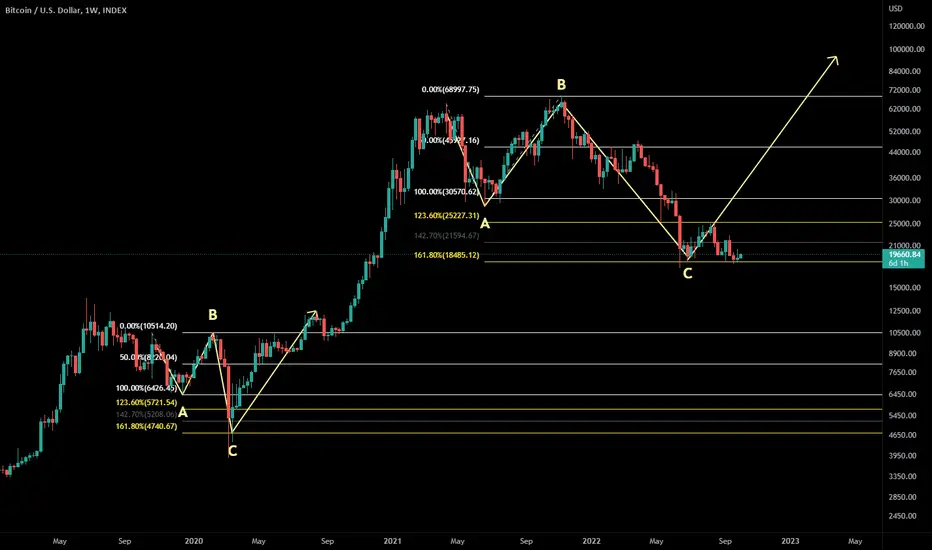
Just a quick post here. I included this as a screenshot in another published chart shown below, but wanted to share this idea by itself.
NOTE -Expanded flat C wave typically stops either at the 1.618 or the 1.236:
- Logarithmic chart has corrected down to the 1.618 exactly.
- Linear chart shows us stopping near the center point between the 1.618 and 1.236, near the 1.427.
Original post:
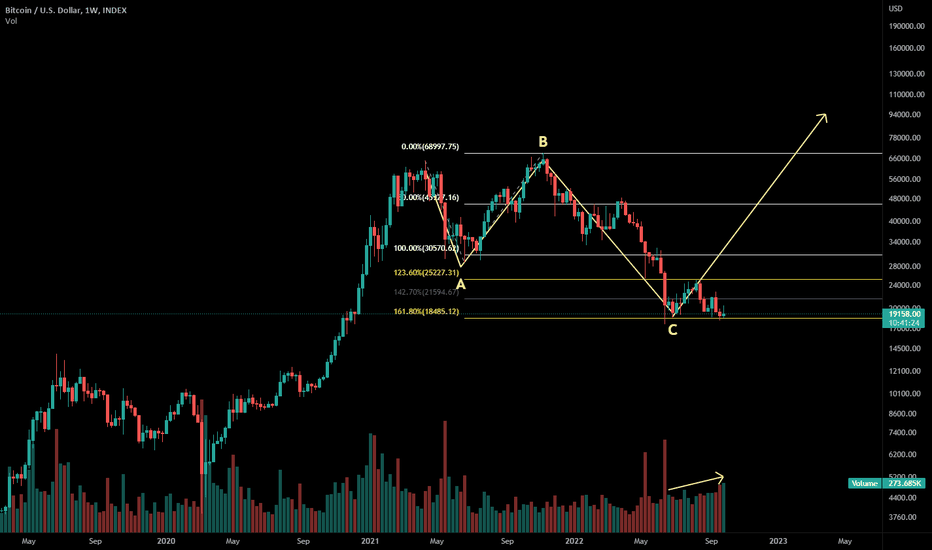
Another note - I'm super bullish on DXY, which should be bearish for crypto and stock markets. For the above move to occur, I'd expect us to see DXY re-test the area around 103.

NOTE -Expanded flat C wave typically stops either at the 1.618 or the 1.236:
- Logarithmic chart has corrected down to the 1.618 exactly.
- Linear chart shows us stopping near the center point between the 1.618 and 1.236, near the 1.427.
Original post:
Another note - I'm super bullish on DXY, which should be bearish for crypto and stock markets. For the above move to occur, I'd expect us to see DXY re-test the area around 103.
Nota
The March 2020 crash/correction linear chart shows it also stopped below the 1.236, but wicked down to or below the 1.618, we haven't yet wicked that low on linear chart.Linear chart fib extension - 2020 pattern:
Nota
Linear chart fib extension - present:Nota
Strong bull divs on 3-day chart:Nota
Back at 1.618, RSI still diverging:Nota
More similarity price vs. RSI:Nota
Quick update - wondering if we might see something like this before we get our impulse up:Nota
3-day chart RSI still showing a strong bull div, but hasn't yet broken out of its downtrend. Presently approaching top of downtrend, a break that gets and stays above ~55-60 would likely be sufficient and lend confluence to the idea of a reversal here. Still some questions: do we see a new price low beforehand, or was RSI low good enough? Will a reversal give us a full recovery / new ATH?
Nota
Dropped below 1.618, weekly bull divs have strengthened:
Publicações relacionadas
Aviso legal
As informações e publicações não se destinam a ser, e não constituem, conselhos ou recomendações financeiras, de investimento, comerciais ou de outro tipo fornecidos ou endossados pela TradingView. Leia mais nos Termos de Uso.
Publicações relacionadas
Aviso legal
As informações e publicações não se destinam a ser, e não constituem, conselhos ou recomendações financeiras, de investimento, comerciais ou de outro tipo fornecidos ou endossados pela TradingView. Leia mais nos Termos de Uso.