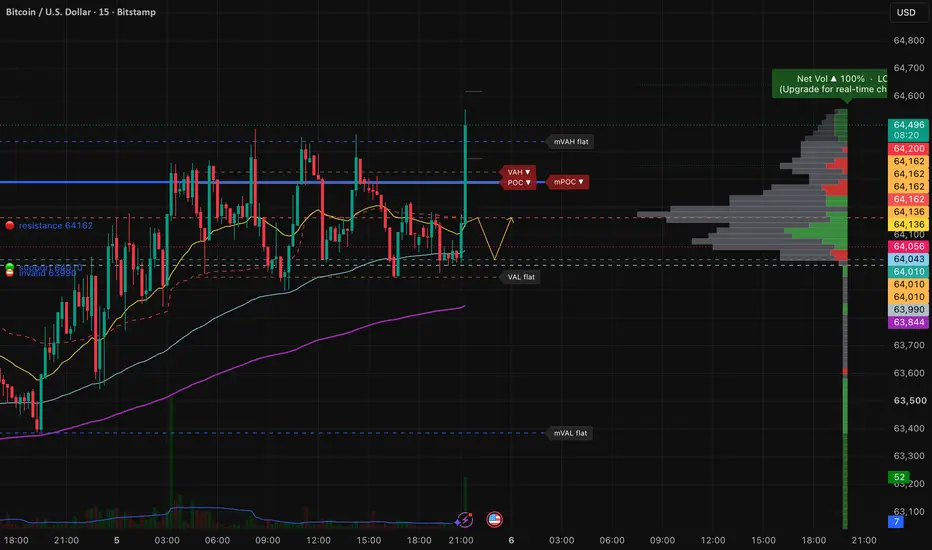
 BTCUSD — pre-US-session read from my KenKem Master Volume Profile (MVP) indicator & strategy. Educational, neutral, scenario-based.
CONTEXT
Read taken at 12:00 UTC, roughly half an hour before the US session opens at 12:30 UTC, so this is a pre-session map rather than an in-session call. Price is at 64,166, just reclaiming VWAP at 64,162, and sits above the M15 EMA25 > EMA100 > EMA200 stack (64,105 / 64,033 / 63,837). It is still in the lower half of the value area, with the Point of Control overhead. On M5 the net-volume read is strongly bid and the value-area low node is still being defended, while the POC above carries net-sell pressure.
KEY ZONES
• Resistance / supply: 64,162 (VWAP), then 64,283 (POC), then 64,370 (master VAH)
• Support / demand: 64,010 (value-area low), then 63,967, then 63,837 (EMA200)
• Point of Control (volume magnet): 64,283
SCENARIOS (to watch — NOT signals)
📈 Bullish: hold above 64,162 → room toward 64,283 then 64,370 (EMA stack aligned up, net volume bid, value-area low defended). First touch of the POC often rejects — it still carries net-sell.
📉 Bearish: lose 64,010 on a closing basis → opens 63,967 then 63,837 (lower highs all day from 64,482; price still under the POC magnet). The value-area low is a defended node, so a first probe down can snap back hard.
↔️ Range/unclear: stuck 64,010–64,162 → stand aside until a decisive close. M5 moving averages are tangled inside a ~40 dollar band and the profile nodes read flat.
⚡ Watch the 12:30 UTC open for a liquidity sweep through either rail that immediately reverses — wicks are not breaks; wait for the close.
⛔ Invalidation: an M15 close below 63,990 voids this map and opens the air pocket toward the EMA200.
WHAT THE MVP TOOL IS SHOWING
The Master Volume Profile plots rolling value areas (VAH/VAL), the Point of Control, and a net-volume pressure read to locate where volume is building or drying up, and tags each node by whether it is still being defended or has been absorbed. This idea is the qualitative output of that tool; the strategy's internal thresholds, gating and entry/exit logic are not disclosed.
Note on precision: the profile levels above are read off the chart's price axis this session and are approximate to within a few tens of dollars; the moving-average, VWAP and price figures are exact reads.
Built with the KenKem Master Volume Profile indicator & strategy.
Technical analysis only, by KenKem's algorithm — NOT financial advice. Trade your own plan and manage your risk.

Quant developer who runs kenkem.biz.
I build trading strategies for XAUUSD, BTCUSD and more.
Just open the Strategy Tester, look at the PF, drawdown, and trade count, then judge the work 🙂
I build trading strategies for XAUUSD, BTCUSD and more.
Just open the Strategy Tester, look at the PF, drawdown, and trade count, then judge the work 🙂
Aviso legal
As informações e publicações não se destinam a ser, e não constituem, conselhos ou recomendações financeiras, de investimento, comerciais ou de outro tipo fornecidos ou endossados pela TradingView. Leia mais nos Termos de Uso.
Quant developer who runs kenkem.biz.
I build trading strategies for XAUUSD, BTCUSD and more.
Just open the Strategy Tester, look at the PF, drawdown, and trade count, then judge the work 🙂
I build trading strategies for XAUUSD, BTCUSD and more.
Just open the Strategy Tester, look at the PF, drawdown, and trade count, then judge the work 🙂
Aviso legal
As informações e publicações não se destinam a ser, e não constituem, conselhos ou recomendações financeiras, de investimento, comerciais ou de outro tipo fornecidos ou endossados pela TradingView. Leia mais nos Termos de Uso.